Medical technology company Stryker (NYSE: SYK) reported Q4 CY2025 results beating Wall Street’s revenue expectations, with sales up 11.4% year on year to $7.17 billion. Its non-GAAP profit of $4.47 per share was 1.7% above analysts’ consensus estimates.
Is now the time to buy Stryker? Find out by accessing our full research report, it’s free.
Stryker (SYK) Q4 CY2025 Highlights:
- Revenue: $7.17 billion vs analyst estimates of $7.11 billion (11.4% year-on-year growth, 0.8% beat)
- Adjusted EPS: $4.47 vs analyst estimates of $4.40 (1.7% beat)
- Adjusted EPS guidance for the upcoming financial year 2026 is $15 at the midpoint, in line with analyst estimates
- Operating Margin: 25.2%, up from 9% in the same quarter last year
- Free Cash Flow Margin: 26.1%, similar to the same quarter last year
- Organic Revenue rose 11% year on year (beat)
- Market Capitalization: $136.8 billion
“We had an outstanding finish to 2025, driving double-digit sales and adjusted earnings per share growth for the fourth quarter and full year while delivering adjusted operating margin expansion of at least 100 basis points for the second consecutive year,” said Kevin A. Lobo, Chair and CEO, Stryker.
Company Overview
With over 150 million patients impacted annually through its innovative healthcare technologies, Stryker (NYSE: SYK) develops and manufactures advanced medical devices and equipment across orthopedics, surgical tools, neurotechnology, and patient care solutions.
Revenue Growth
Reviewing a company’s long-term sales performance reveals insights into its quality. Any business can put up a good quarter or two, but many enduring ones grow for years. Over the last five years, Stryker grew its sales at a decent 11.8% compounded annual growth rate. Its growth was slightly above the average healthcare company and shows its offerings resonate with customers.
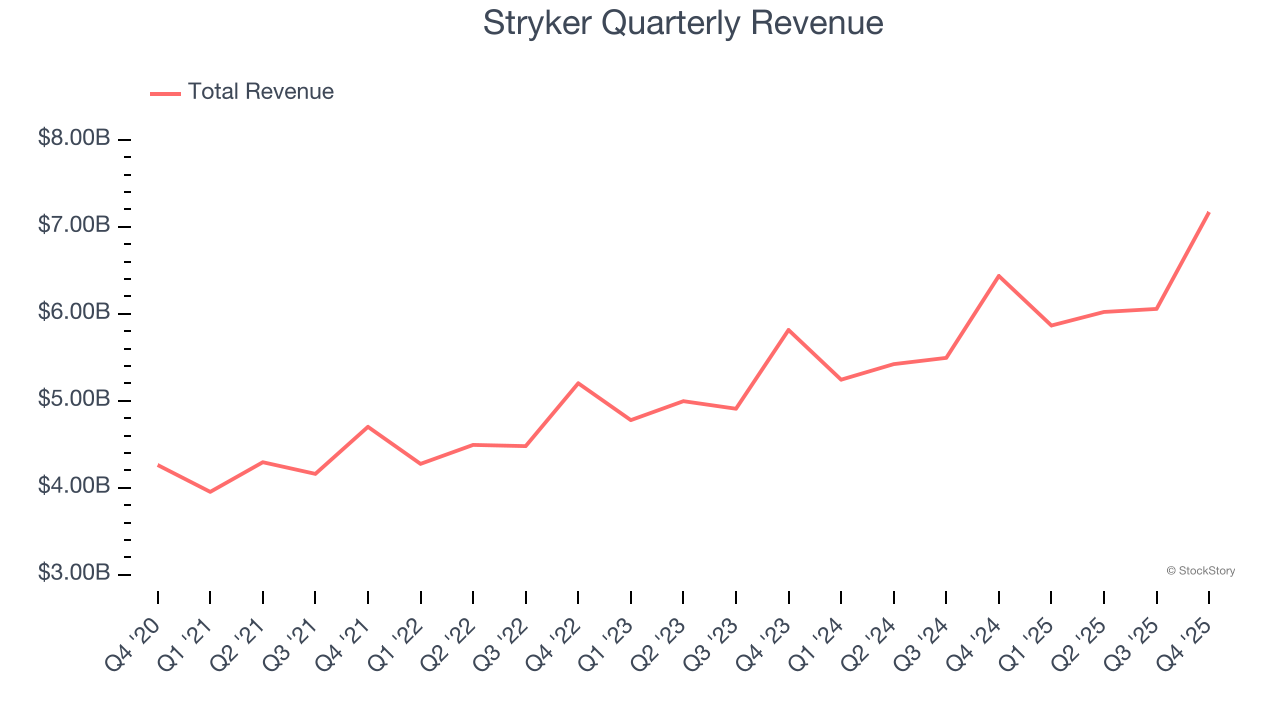
Long-term growth is the most important, but within healthcare, a half-decade historical view may miss new innovations or demand cycles. Stryker’s annualized revenue growth of 10.7% over the last two years is below its five-year trend, but we still think the results were respectable. 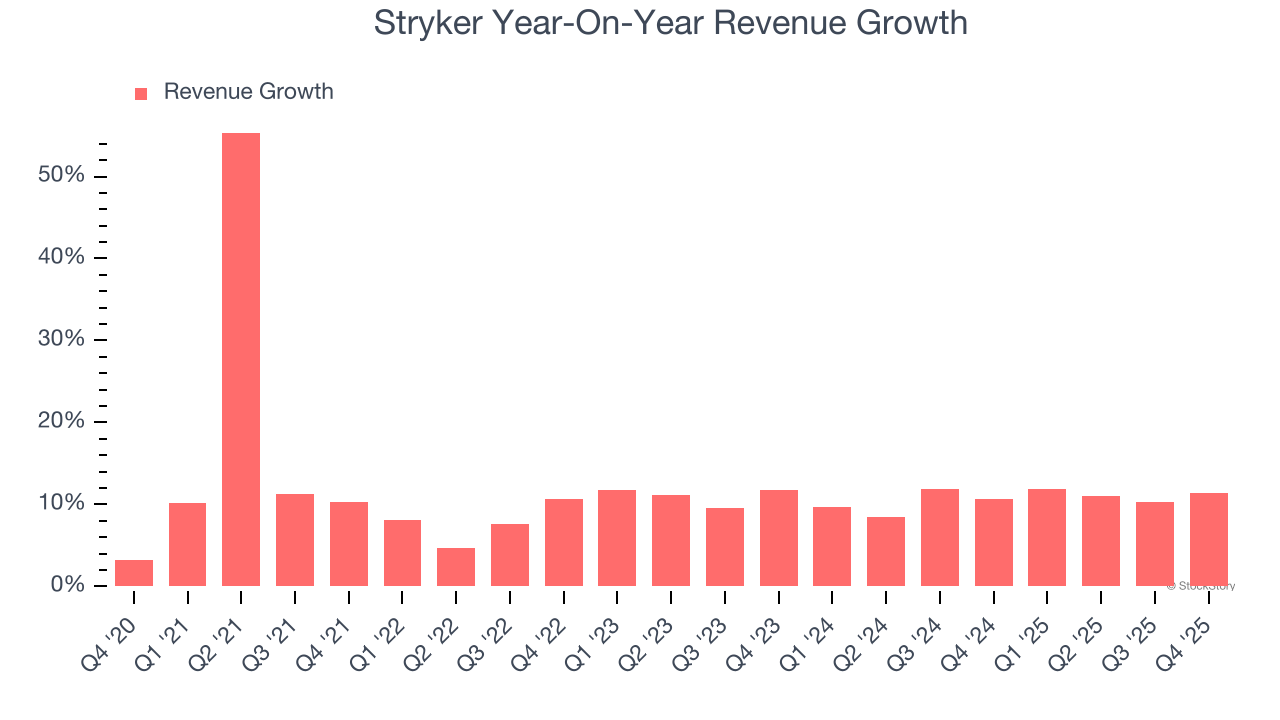
Stryker also reports organic revenue, which strips out one-time events like acquisitions and currency fluctuations that don’t accurately reflect its fundamentals. Over the last two years, Stryker’s organic revenue averaged 10.2% year-on-year growth. Because this number aligns with its two-year revenue growth, we can see the company’s core operations (not acquisitions and divestitures) drove most of its results. 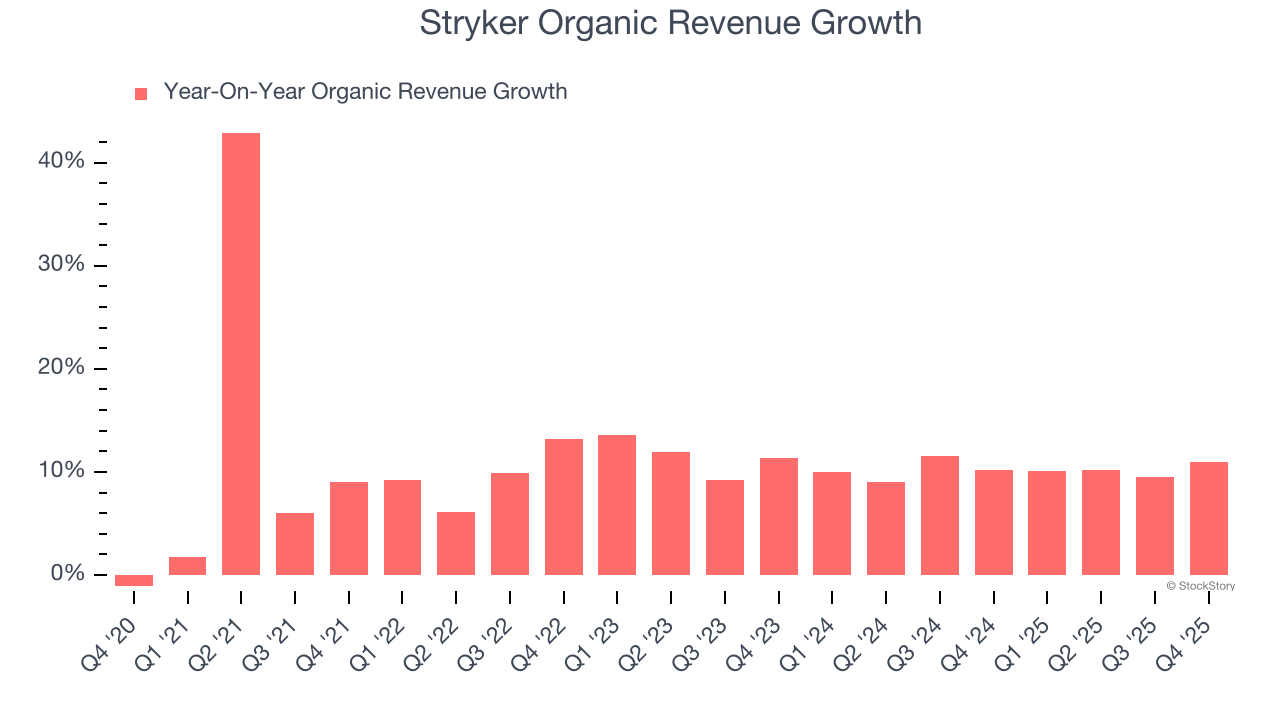
This quarter, Stryker reported year-on-year revenue growth of 11.4%, and its $7.17 billion of revenue exceeded Wall Street’s estimates by 0.8%.
Looking ahead, sell-side analysts expect revenue to grow 8.4% over the next 12 months, a slight deceleration versus the last two years. We still think its growth trajectory is attractive given its scale and suggests the market sees success for its products and services.
The 1999 book Gorilla Game predicted Microsoft and Apple would dominate tech before it happened. Its thesis? Identify the platform winners early. Today, enterprise software companies embedding generative AI are becoming the new gorillas. a profitable, fast-growing enterprise software stock that is already riding the automation wave and looking to catch the generative AI next.
Operating Margin
Operating margin is an important measure of profitability as it shows the portion of revenue left after accounting for all core expenses – everything from the cost of goods sold to advertising and wages. It’s also useful for comparing profitability across companies with different levels of debt and tax rates because it excludes interest and taxes.
Stryker has managed its cost base well over the last five years. It demonstrated solid profitability for a healthcare business, producing an average operating margin of 17.2%.
Analyzing the trend in its profitability, Stryker’s operating margin rose by 4.4 percentage points over the last five years, as its sales growth gave it operating leverage.
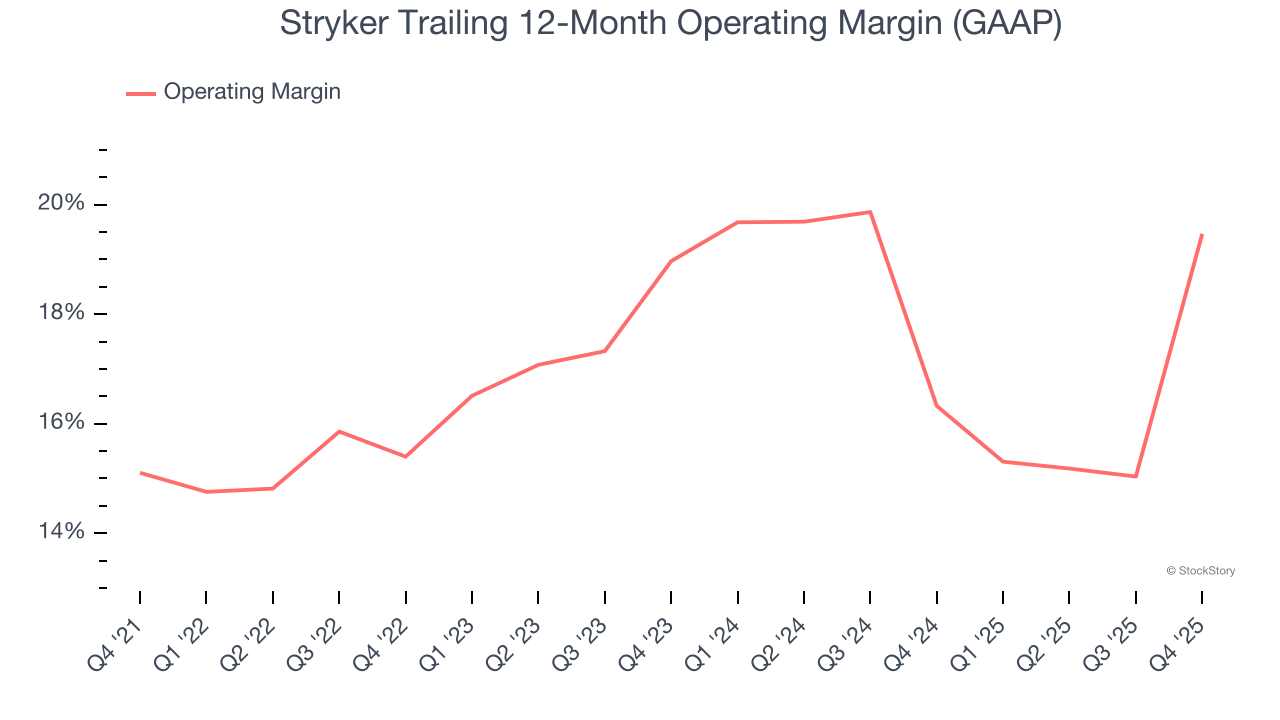
In Q4, Stryker generated an operating margin profit margin of 25.2%, up 16.1 percentage points year on year. This increase was a welcome development and shows it was more efficient.
Earnings Per Share
We track the long-term change in earnings per share (EPS) for the same reason as long-term revenue growth. Compared to revenue, however, EPS highlights whether a company’s growth is profitable.
Stryker’s spectacular 12.9% annual EPS growth over the last five years aligns with its revenue performance. This tells us its incremental sales were profitable.
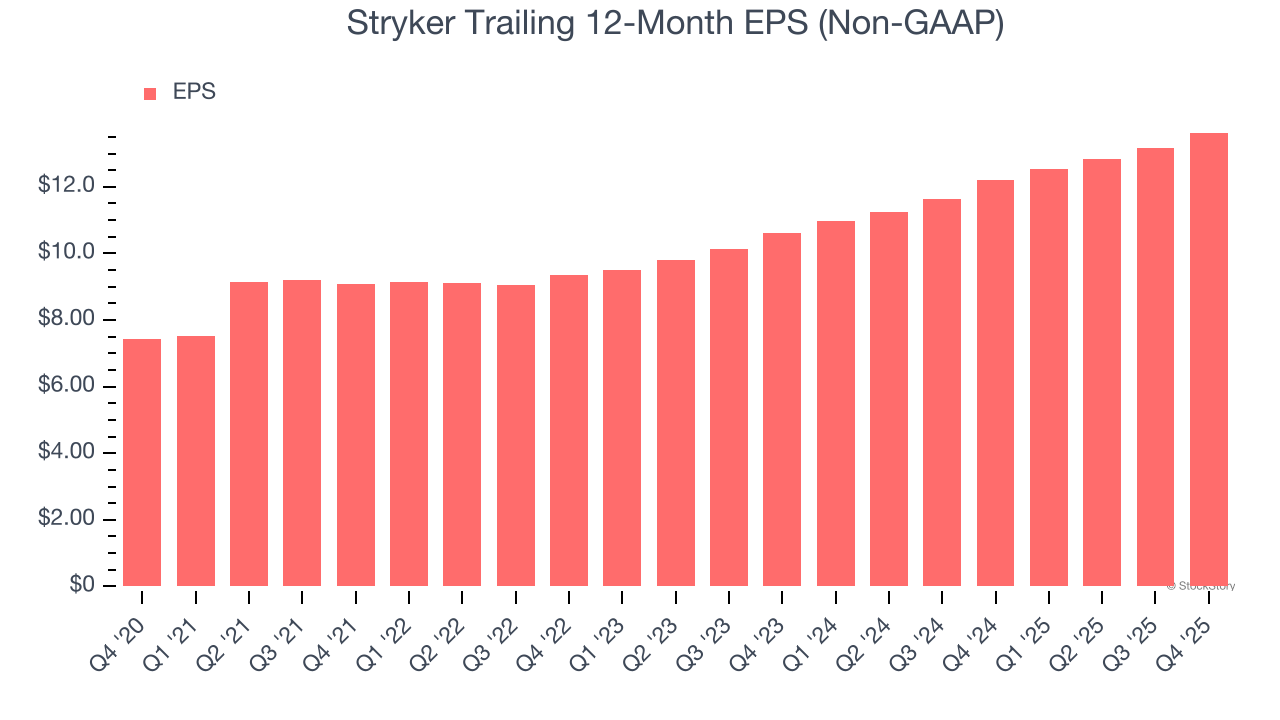
In Q4, Stryker reported adjusted EPS of $4.47, up from $4.01 in the same quarter last year. This print beat analysts’ estimates by 1.7%. Over the next 12 months, Wall Street expects Stryker’s full-year EPS of $13.63 to grow 9.7%.
Key Takeaways from Stryker’s Q4 Results
It was good to see Stryker narrowly top analysts’ organic revenue expectations this quarter, leading to a revenue beat. We were also happy its EPS outperformed Wall Street’s estimates. Overall, this print had some key positives. The stock traded up 2.1% to $361.67 immediately following the results.
So do we think Stryker is an attractive buy at the current price? The latest quarter does matter, but not nearly as much as longer-term fundamentals and valuation, when deciding if the stock is a buy. We cover that in our actionable full research report which you can read here (it’s free).