
Following a decline in revenue last year due to reduced demand from the PC and smartphone markets, the semiconductor industry is poised for a rebound in 2024, driven by robust growth in the memory market. According to Gartner (IT), global chip revenue is expected to grow 16.8% this year to reach $624 billion.
Against this optimistic backdrop, chipmaker QUALCOMM Incorporated (QCOM) reported its fiscal first-quarter (ended December 24, 2023) results this week. Its non-GAAP revenues grew 5% year-over-year to reach $9.92 billion, topping the $9.51 billion expected, while its adjusted EPS increased 16% from the prior-year period to $2.75 compared to the expected figure of $2.37.
Furthermore, the company is attempting to diversify its revenue stream by branching out of its core competency of smartphone chips to other avenues, including its push to sell chips to automakers and car suppliers. For the next quarter, QCOM expects non-GAAP EPS between $2.20 - $2.40 and revenue of $8.90 billion to $9.70 billion.
Following its earnings beat, let’s look at the trends of QCOM’s key financial metrics to understand why the stock could be a solid buy now.
Analyzing Financial Performance Trends of QUALCOMM Incorporated (QCOM) from 2021 to 2023
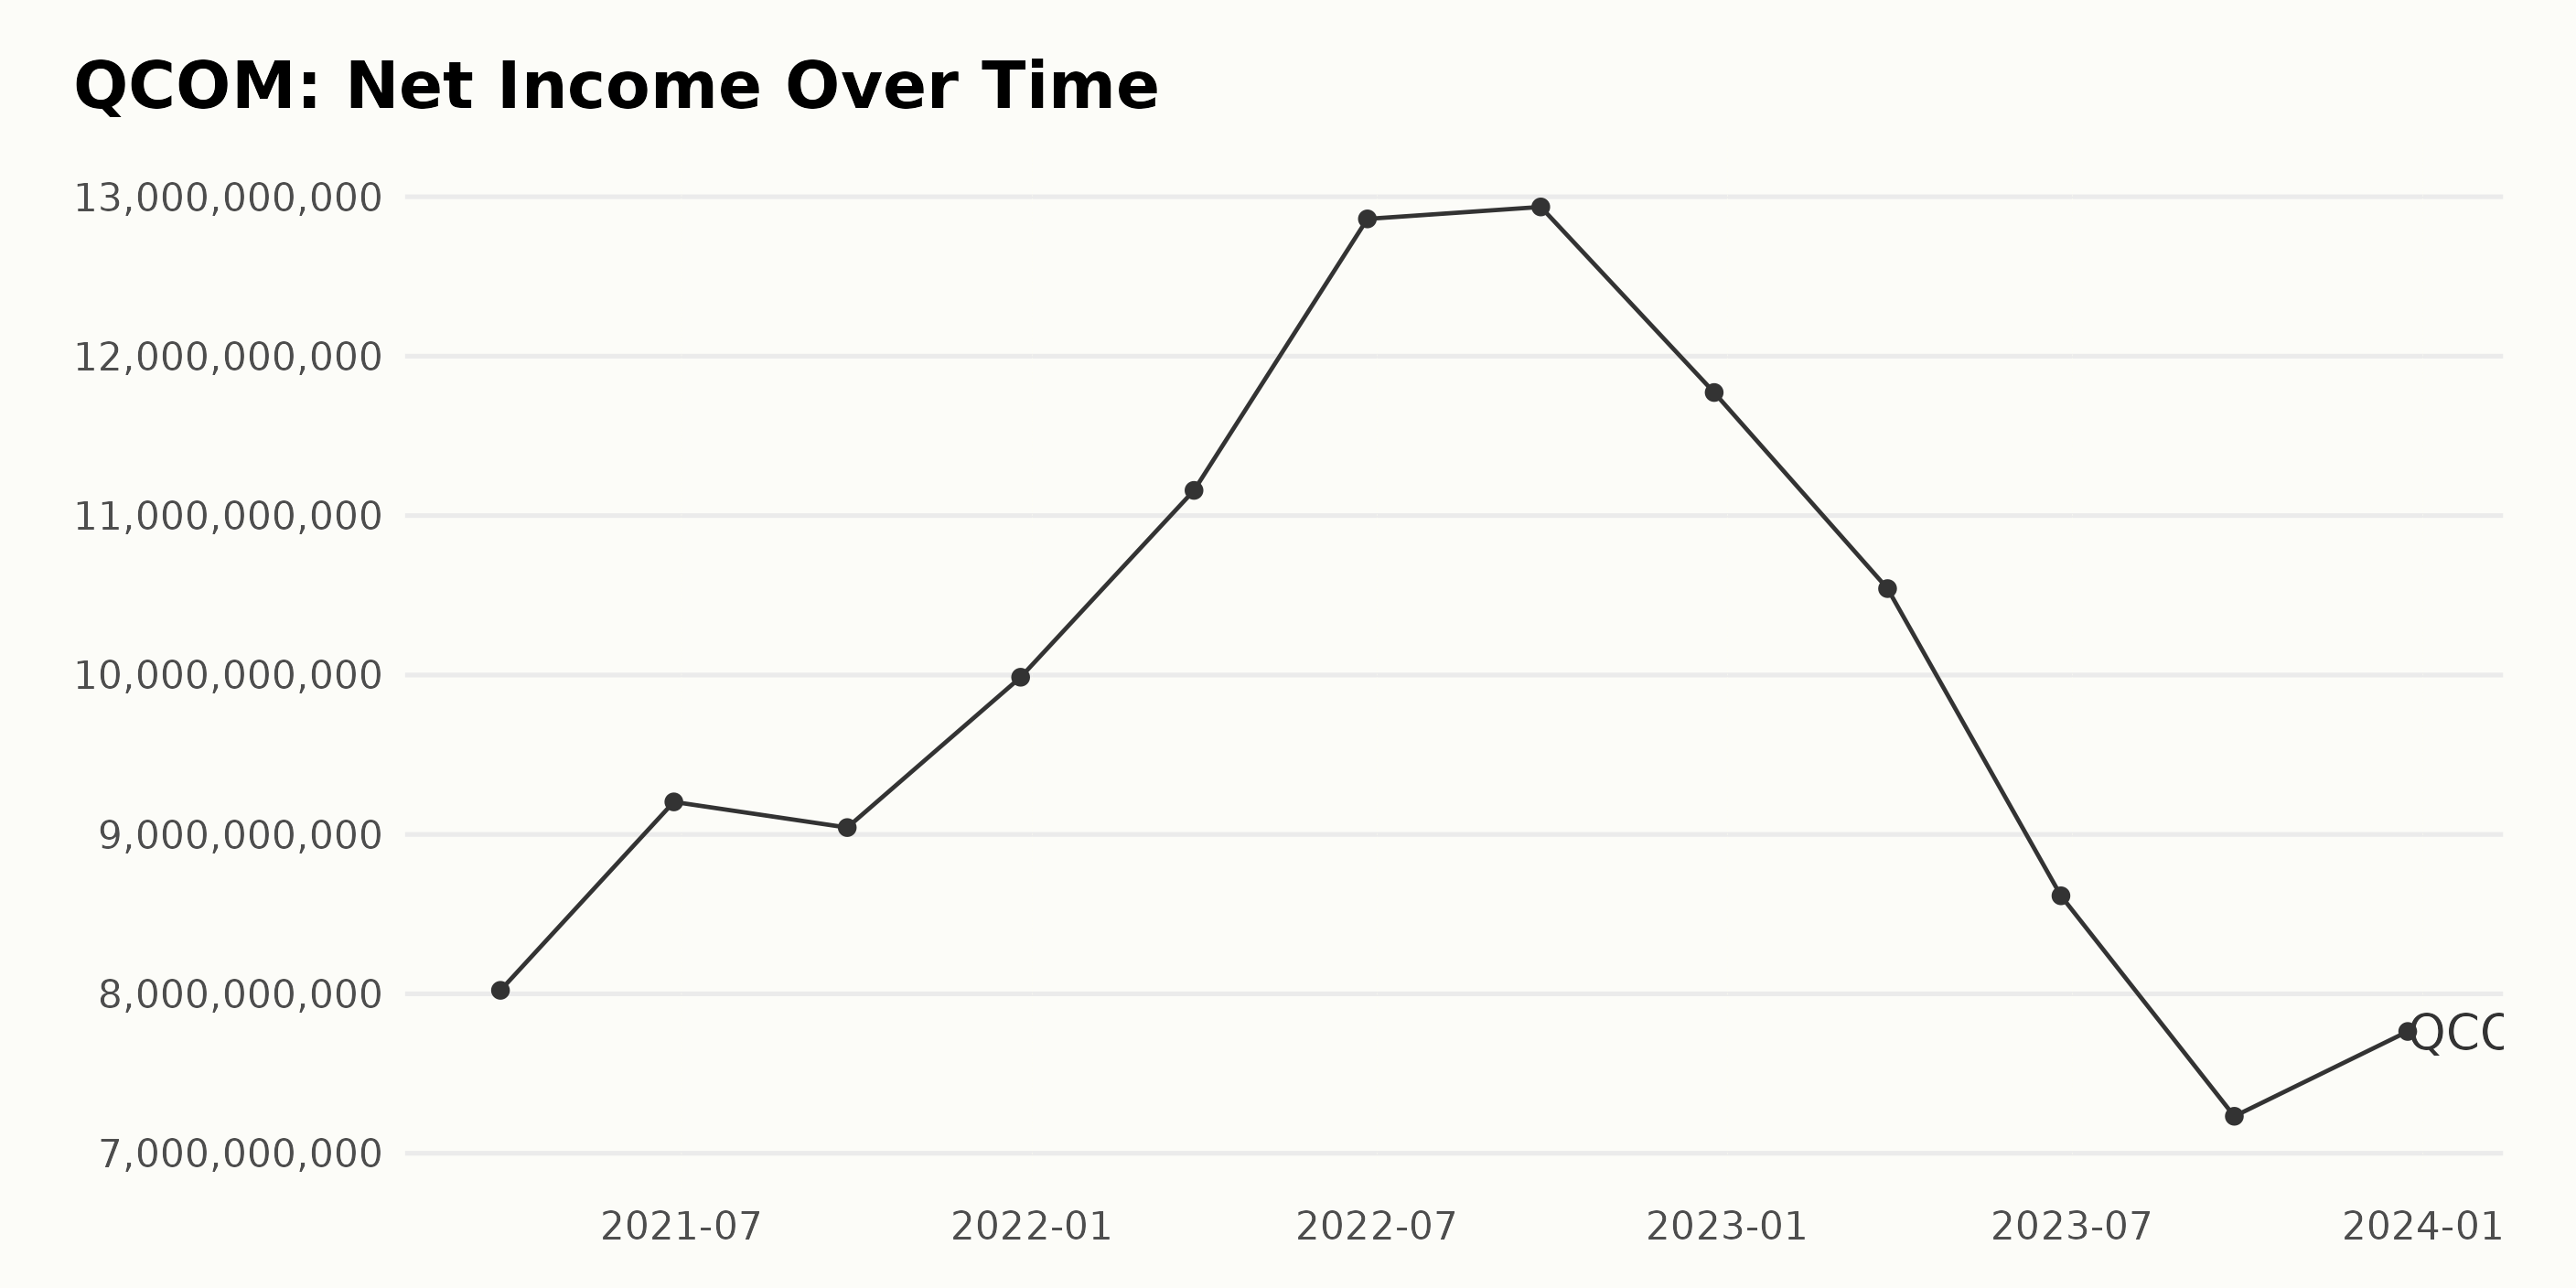
The trend and fluctuations in the trailing-12-month net income of QCOM are as follows:
- Starting from March 28, 2021, with a net income of $8.02 billion, there was a steady increase leading up to June 26, 2022, where it maximized at $12.86 billion.
- After that peak, there was a minor increase to $12.93 billion by September 25, 2022, followed by a decline to $11.77 billion by December 25, 2022.
- The illustrated downward trend continued through March 26, 2023, with net income bottoming out at $7.23 billion on September 24, 2023.
- Although there was a slight increase to $7.76 billion by December 24, 2023, it was still significantly lower than the previous high points.
Calculating growth, the net income decreased by approximately $0.26 billion or 3.24% from the initial value of $8.02 billion on March 28, 2021, to the last recorded value of $7.76 billion on December 24, 2023. It's notable that there is a strong fluctuation in the data.
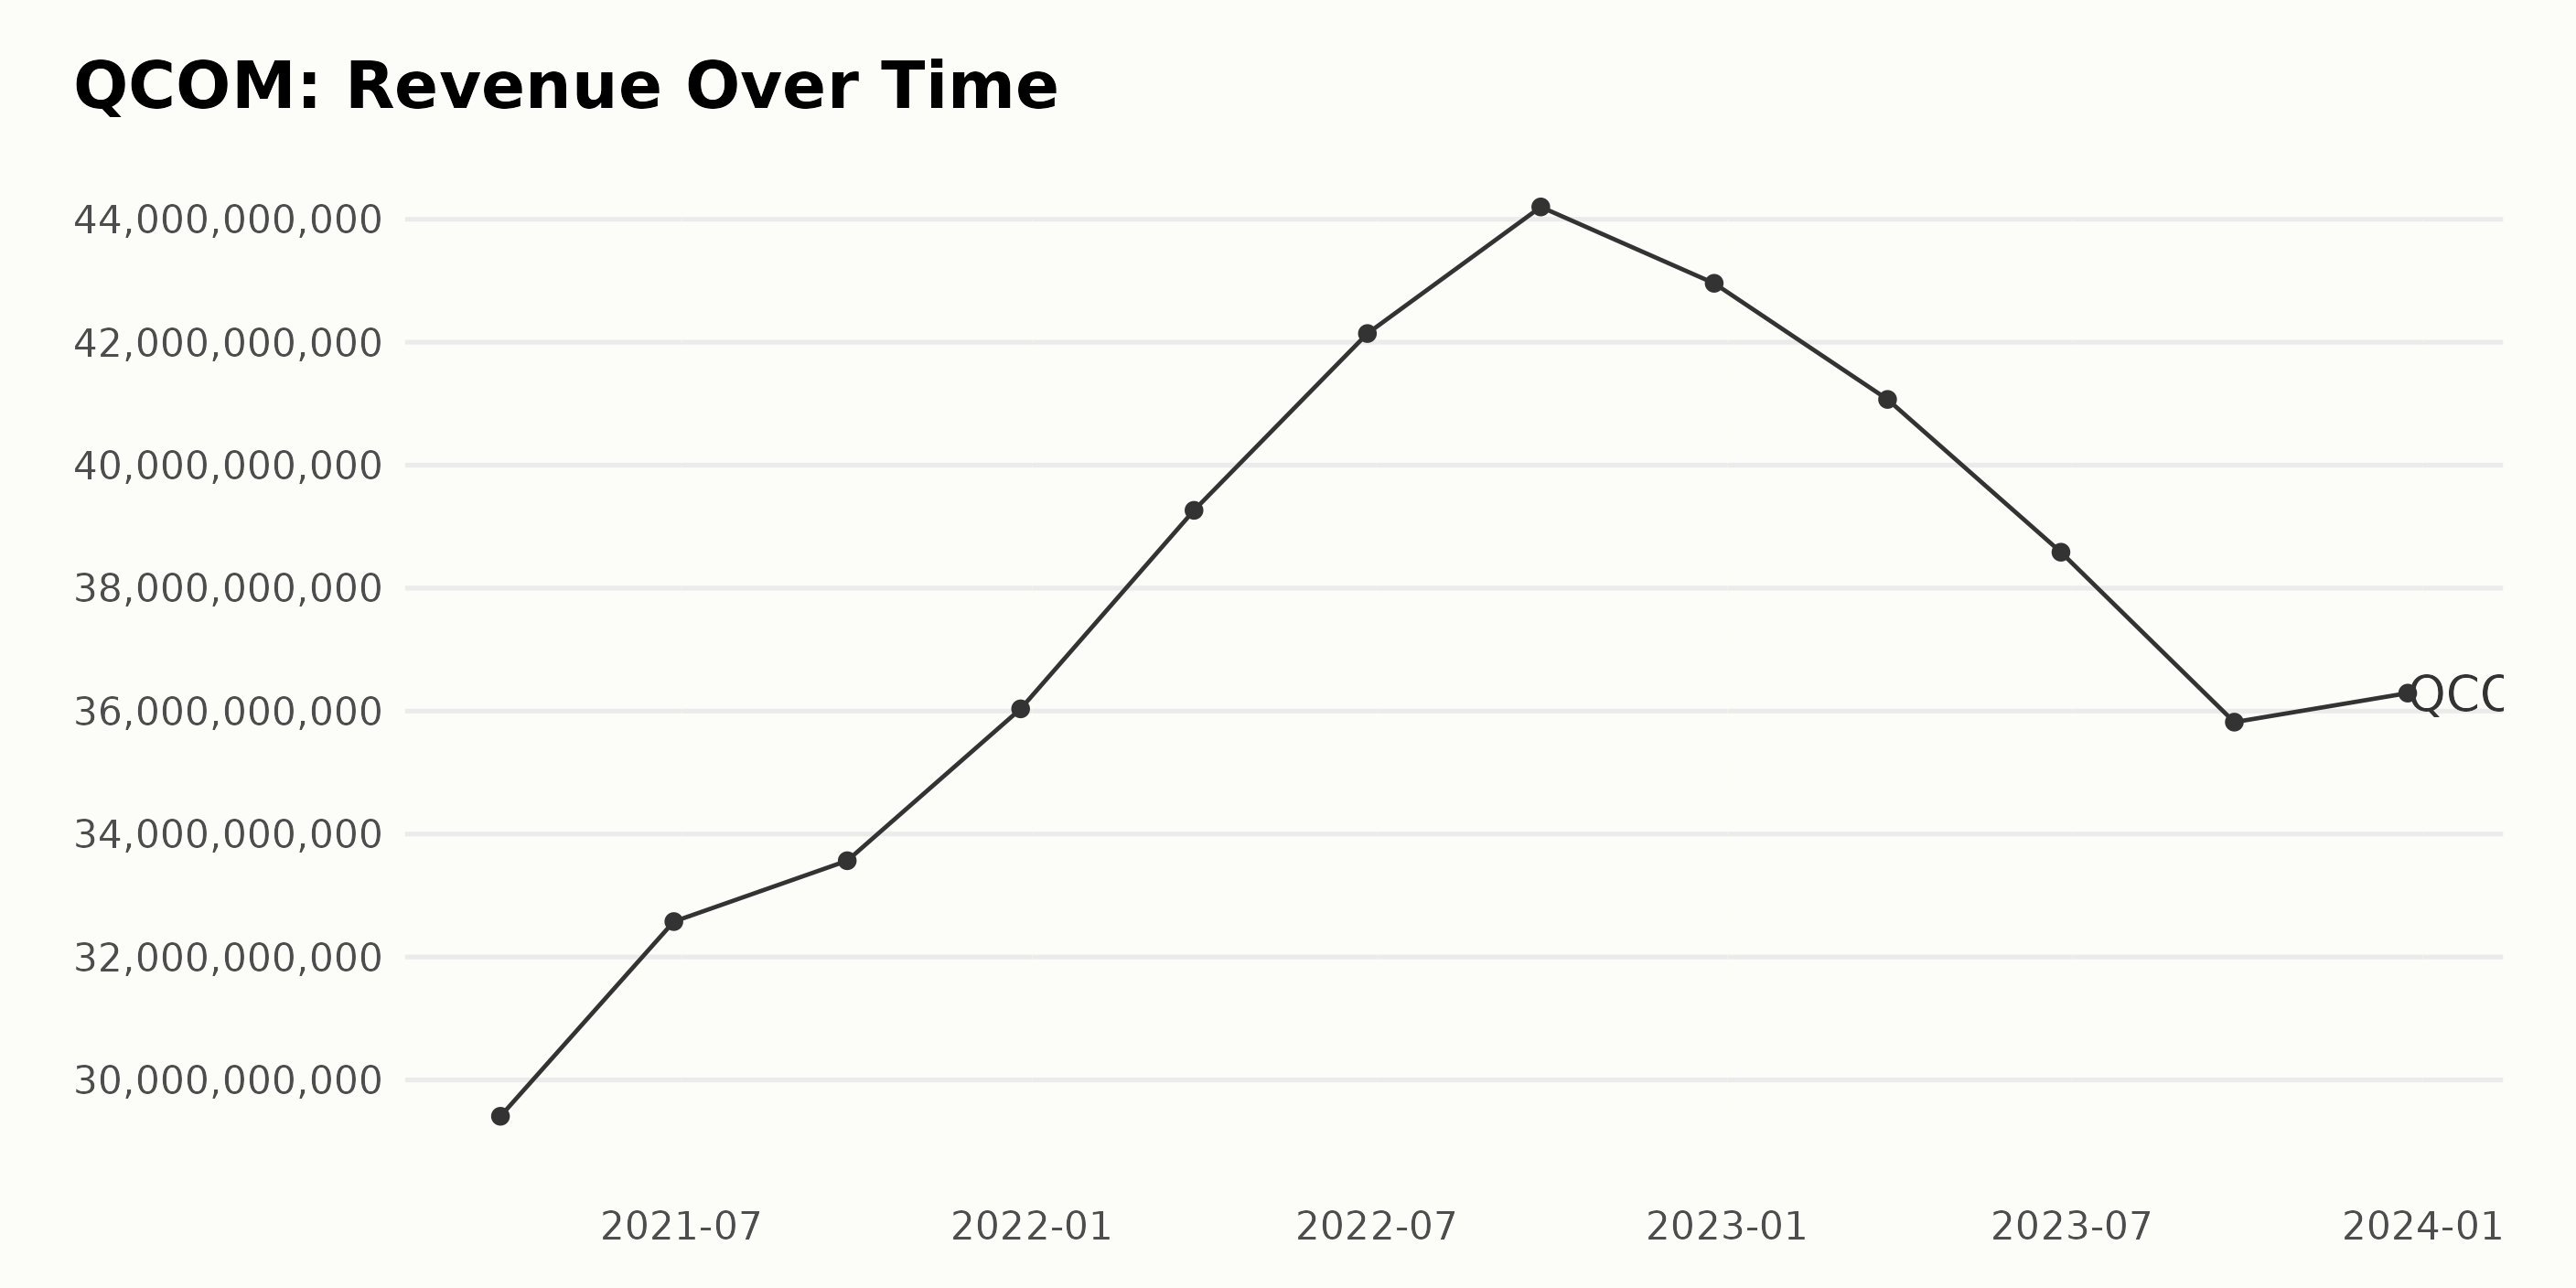
The trailing-12-month revenue of QCOM has demonstrated a significant trend and fluctuations over a period from March 2021 to December 2023, as evident in the provided data.
- The revenue of QCOM started at $29.41 billion on March 28, 2021.
- A consistent growth in revenue was observed throughout 2021 and the first half of 2022, taking the figures from $29.41 billion in March 2021 to the peak of $44.20 billion by September 25, 2022.
- However, the latter half of 2022 saw a drop in revenue to $42.96 billion by December 25, 2022.
- A continuous decline in revenue is notable throughout 2023, with a low point of $35.82 billion by September 24, 2023.
- A slight increase was noted as the year ended, with the revenue rising to $36.29 billion by December 24, 2023.
Evaluating the growth rate from the first value ($29.41 billion) to the last value ($36.29 billion), there is an overall growth rate of approximately 23.41%. Noteworthy, however, is the declining pattern seen in the last quarter of 2022, which extends through 2023. Throughout this period, QCOM's earnings have generally fluctuated.
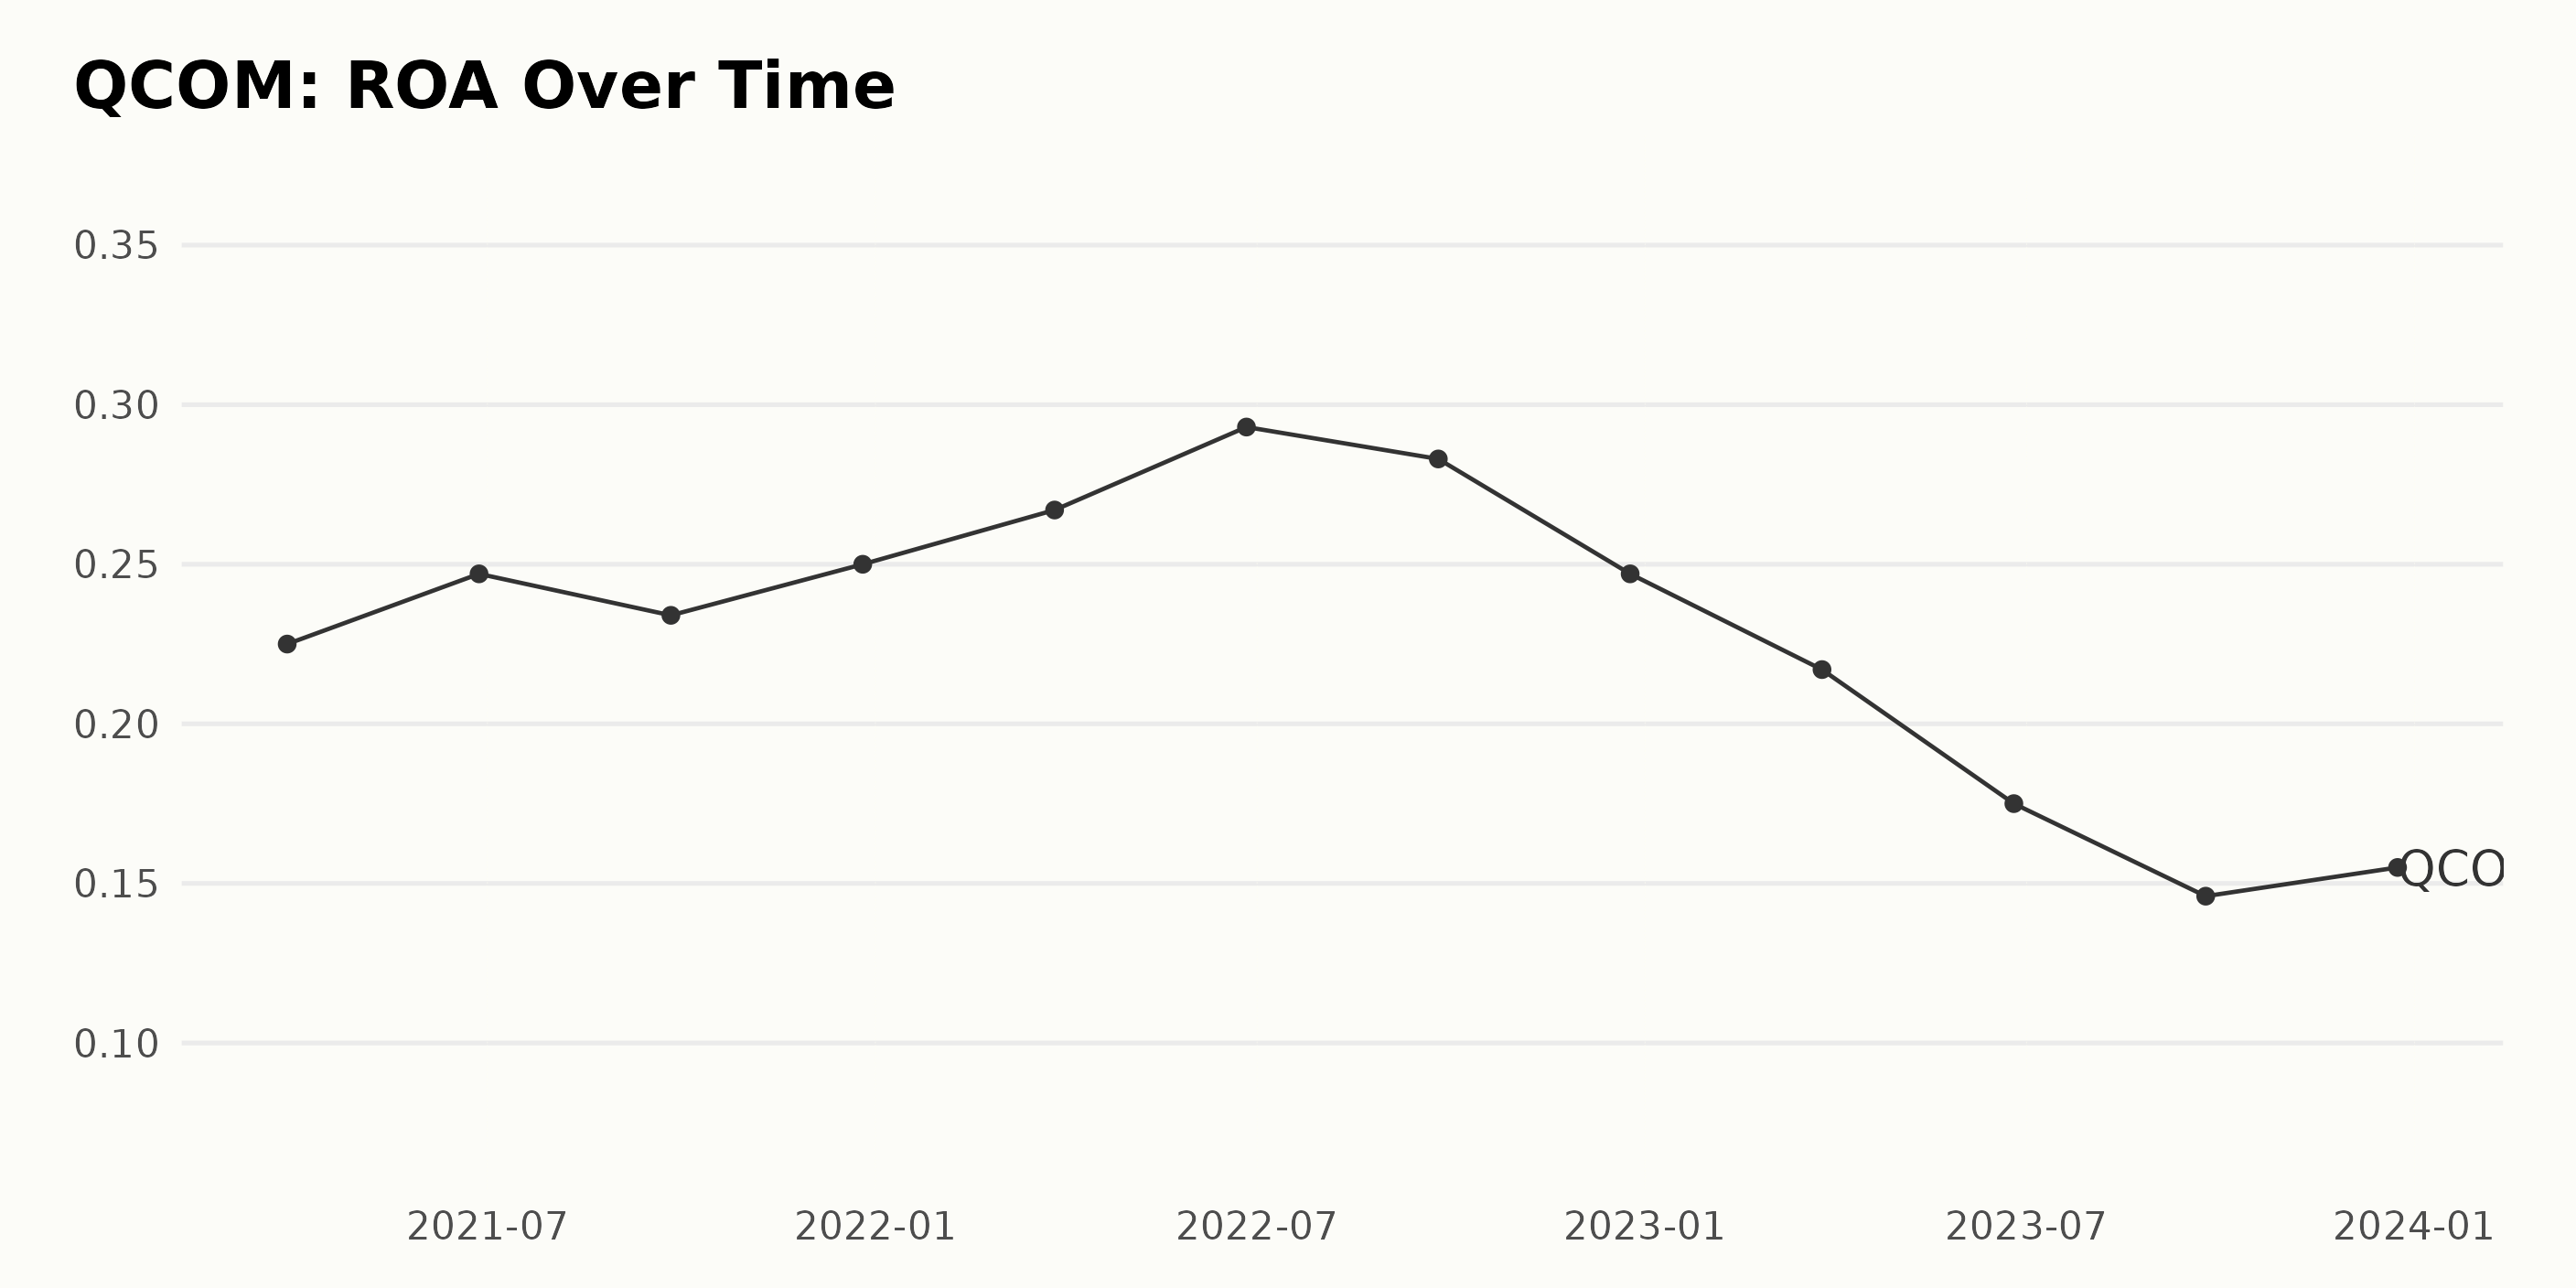
The overall trend and fluctuations of the Return On Assets (ROA) for QCOM can be observed across a variety of data points from March 2021 to December 2023. The key points are as follows:
- March 28, 2021: The reported ROA was 0.225
- June 27, 2021: The ROA increased to 0.247
- September 26, 2021: A minor drop was noted with a ROA of 0.234
- December 26, 2021: The ROA rose slightly to 0.250
- March 27, 2022: Another increment was witnessed, with the ROA being 0.267
- June 26, 2022: This period marked the highest ROA value in the series, being 0.293
- September 25, 2022: The ROA decreased to 0.283
- December 25, 2022: A ROA of 0.247 was recorded, indicating another fall
- March 26, 2023: The ROA further dropped to 0.217
- June 25, 2023: Marking another reduced figure, this quarter ended with a ROA of 0.175
- September 24, 2023: Continuing the downward trend, the ROA reported was 0.146, the lowest in the series
- December 24, 2023: The last recorded value shows a minor rise in ROA to 0.155
In conclusion, the ROA for QCOM experienced a significant trend of growth from March 2021 to June 2022, peaking at 0.293. Since its peak, the ROA has been exhibiting a downward trend with intermittent fluctuations.
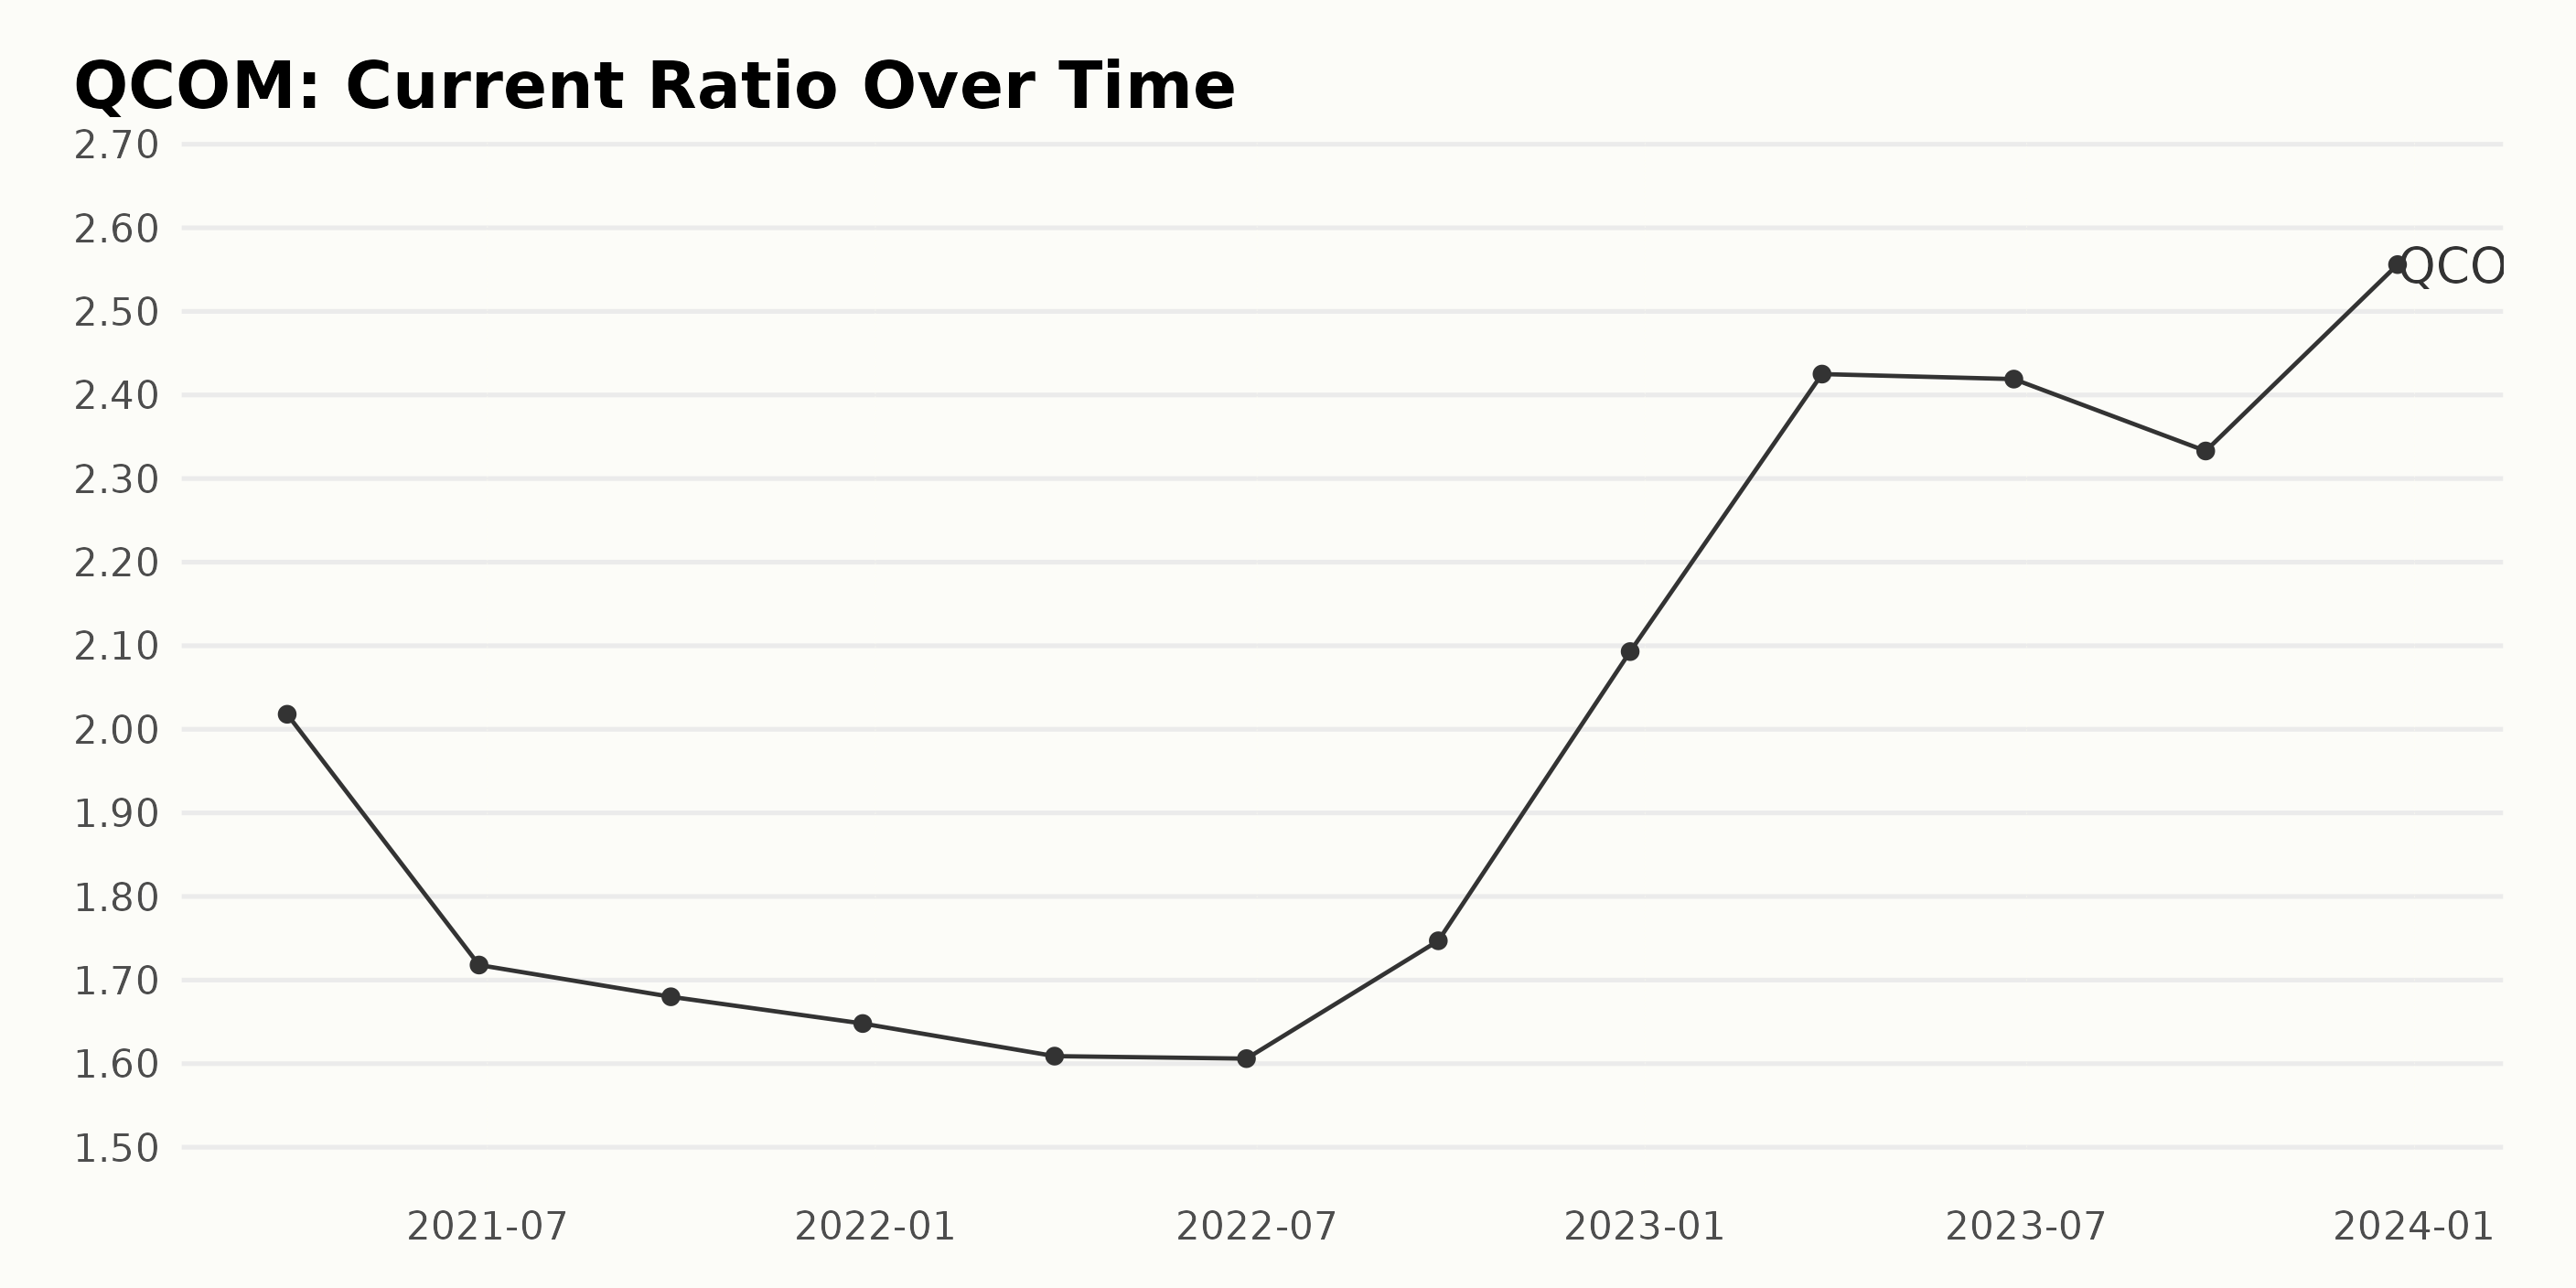
The following is a summary of the trends and fluctuations of the current ratio for QCOM:
- In March 2021, the current ratio for QCOM was reported as 2.02. Over the next year, this value tended to decrease, reaching 1.61 by March 2022.
- Between March 2022 and June 2022, there was a slight fluctuation in the current ratio, decreasing minimally from 1.61 to 1.606.
- From June 2022 to December 2022, QCOM witnessed a significant increase in its current ratio, moving from 1.606 to 2.093. This represents an uptick in the company's ratio after a prolonged period of reduction.
- Moving ahead, the current ratio continued to rise dramatically; it grew from 2.093 in December 2022 to 2.425 in March 2023.
- The current ratio marginally dropped to 2.419 in June 2023, hinting at a brief pause in the previously consistent growth trend.
- Subsequently, it declined further to 2.333 in September 2023 but rose swiftly to 2.556 in December 2023, marking the highest value in the data series.
In summary, the overall trend suggests a decline in the current ratio of QCOM until June 2022, followed by a substantial recovery and persistent improvement until the end of the observed range in December 2023. The growth rate from March 2021 to December 2023 is approximately 26.64%, indicating a healthy escalation despite the temporary pullbacks observed during this timeframe.
Analyzing QUALCOMM's Share Price Trends from August 2023 to January 2024
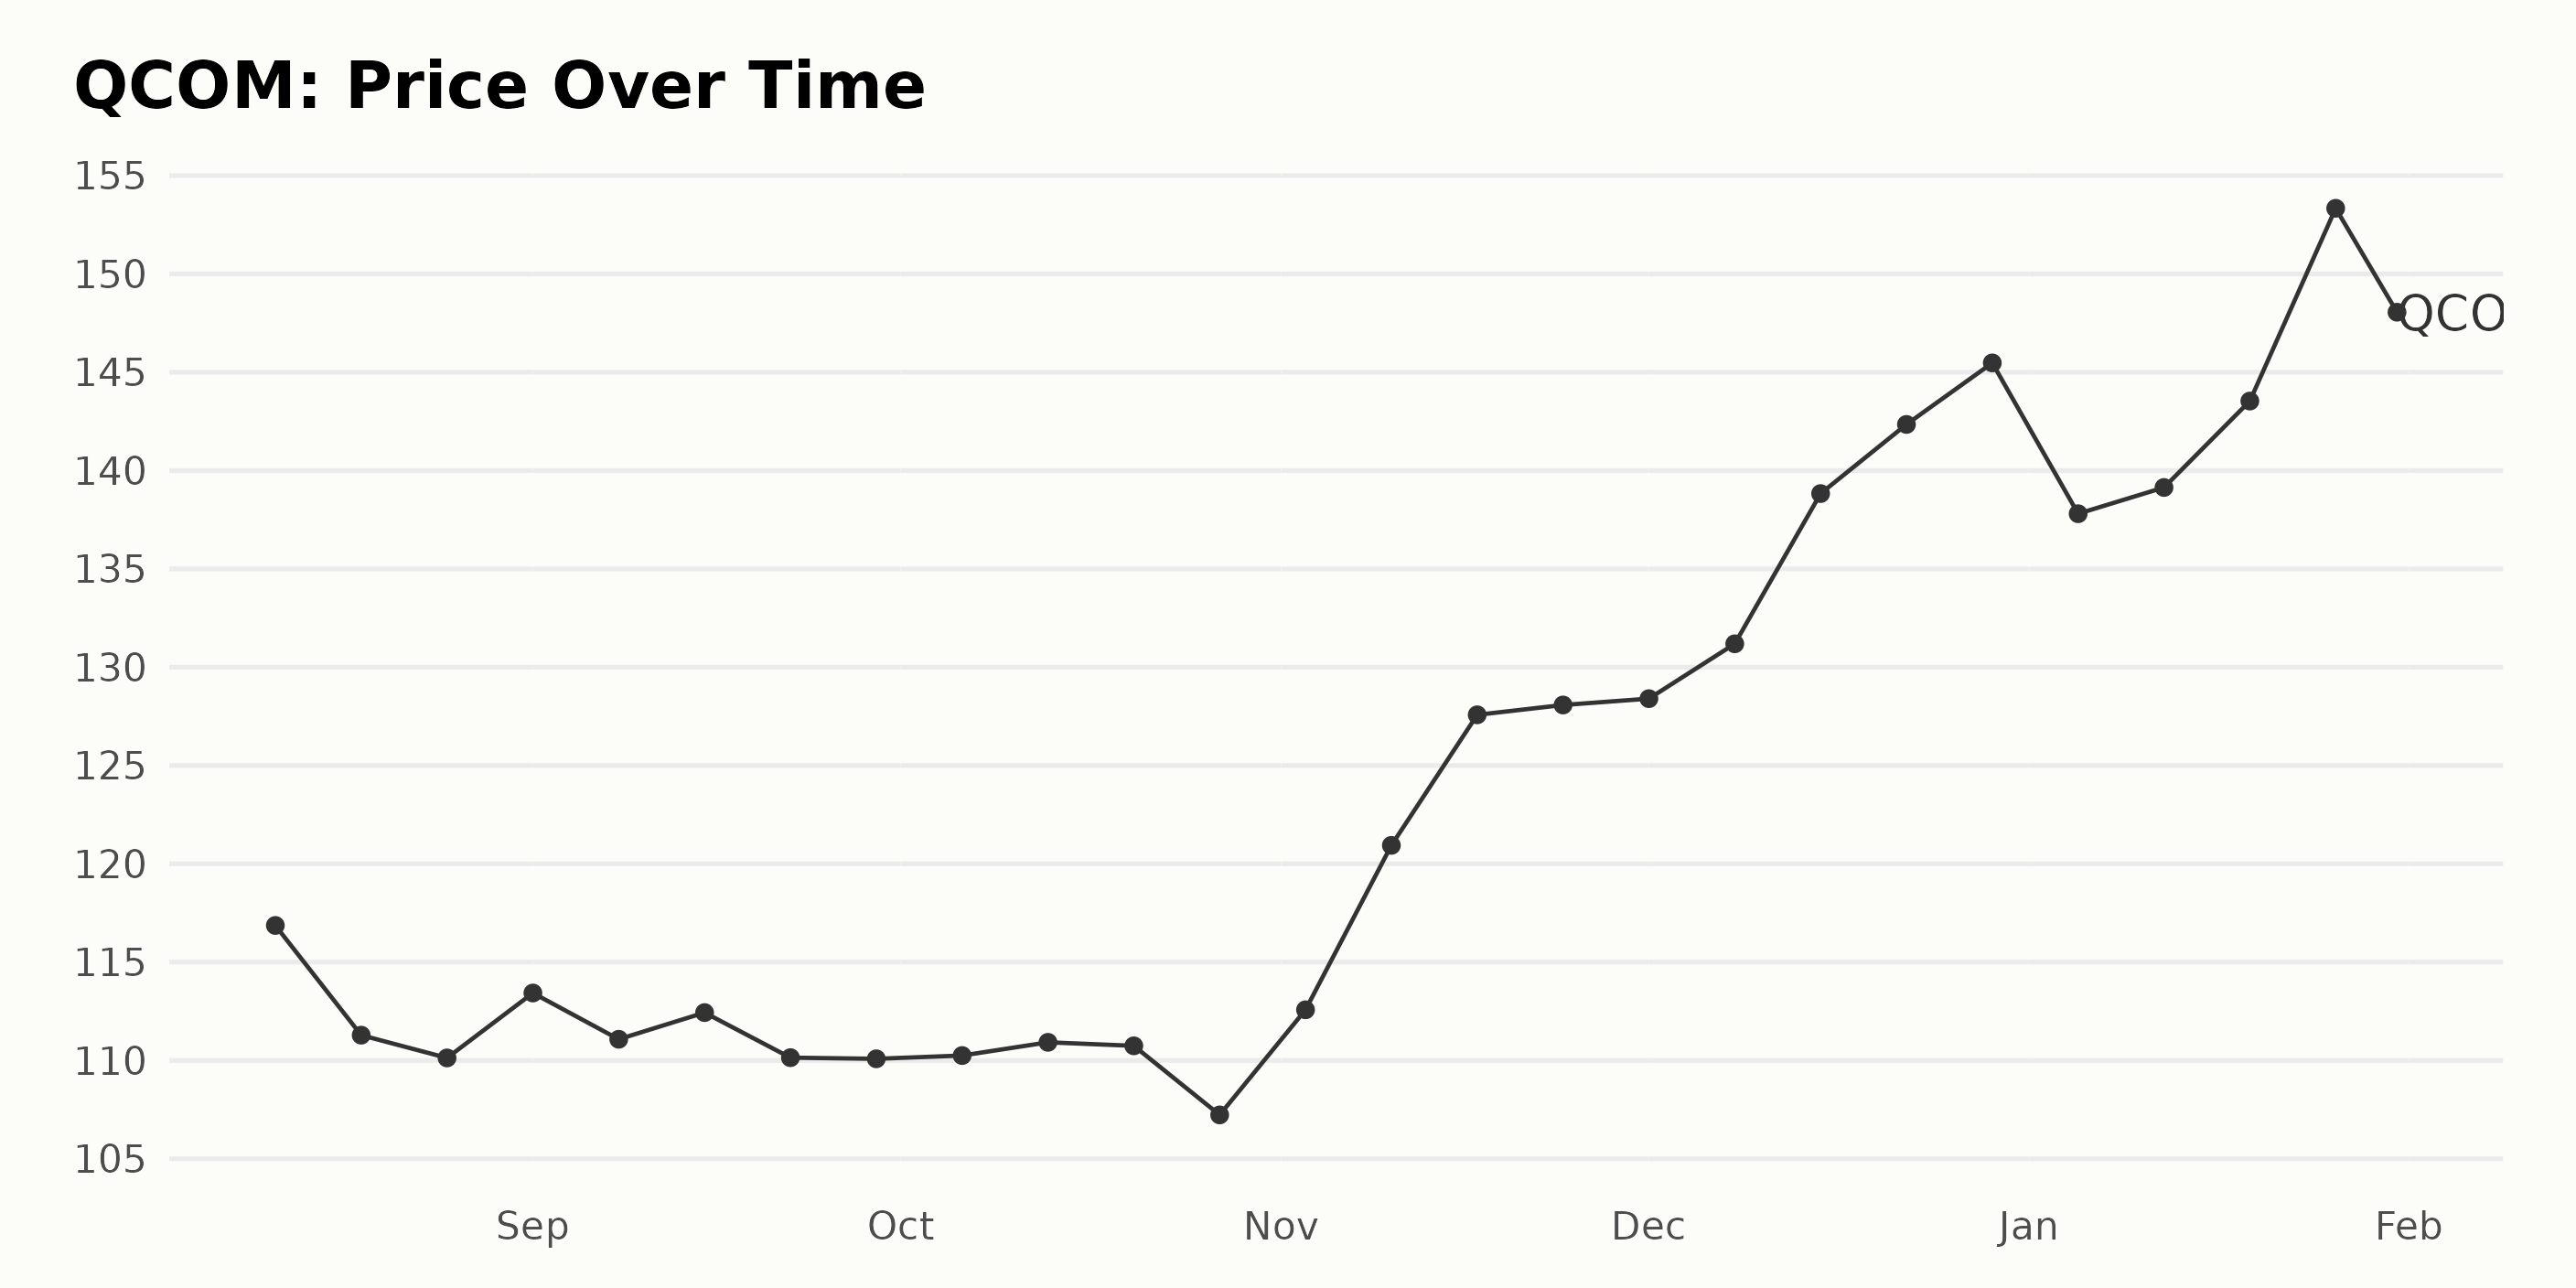
The dataset represents the weekly share price of QCOM from August 2023 to January 2024. From a general overview, it shows a gradual deceleration in their share prices before accelerating from November 2023 onwards. Here are some significant points to note:
- The price started at $116.87 on August 11, 2023, and steadily decreased till it reached $110.13 on August 25, 2023.
- It remained relatively stable around the $110 to $113 range from late August to early October 2023, with minor fluctuations.
- There was a momentary dip to $107.23 on October 27, 2023. However, the overall trend was still consistent with the previous month.
- A noticeable growth trend began on November 3, 2023, when the stock was priced at $112.58. From there, there was a distinct uptrend, with the price skyrocketing to $120.94 by November 10, 2023.
- This acceleration continued till the end of the year, reaching its pinnacle at $145.47 on December 29, 2023, representing a nearly 30% increase in two months.
- Finally, the first month of 2024 showed a slight volatility. The price slightly fell to $137.81 on January 5, 2024. However, towards the end of the month, the stock soared to its highest point in this dataset - $153.34 on January 26, 2024. The end of the month saw a slight depreciation to $148.51.
Overall, the data suggests a growth rate that significantly accelerated in the last three months of 2023, then became more volatile at the beginning of 2024, experiencing both ups and downs. Here is a chart of QCOM's price over the past 180 days.
Analyzing QUALCOMM's Performance: Quality, Value, and Momentum Trends in 2023-2024
QCOM, a stock in the Semiconductor & Wireless Chip category, has shown a noticeable performance based on its POWR Ratings grades from August 2023 to January 2024. Here is a detailed overview:
- POWR grade for the week ending August 5, 2023, was B (Buy). It was ranked 20th in its category out of a total of 91 stocks.
- In the month of August 2023, the rank in the category improved marginally, ending at 18 on August 26, 2023, maintaining the POWR grade of B (Buy).
- Through the month of September, the POWR grade fluctuated slightly, dropping to a C (Neutral) in the week ending September 23, 2023, but then reverted to B (Buy). Its rank also varied between 17 and 22 during this month.
- In October 2023, QCOM's rank in its category improved significantly to 13, while the POWR grade remained stable at B (Buy).
- There was an exceptional performance in November 2023 when it climbed the ranks, reaching 7th position among the 91 stocks in the Semiconductor & Wireless Chip category. The POWR grade held steady as B (Buy) throughout this period.
- For the weeks till December 30, 2023, QCOM maintained its POWR grade of B (Buy), although there was a slight uptick in rankings to 13 before improving again to end the year at 8.
- As of February 1, 2024, the POWR grade stands at B (Buy), with QCOM ranking 9th in the category.
These consistent B (Buy) grades and its performance within the top quartile of its category demonstrate QCOM's positive positioning within the Semiconductor & Wireless Chip category.
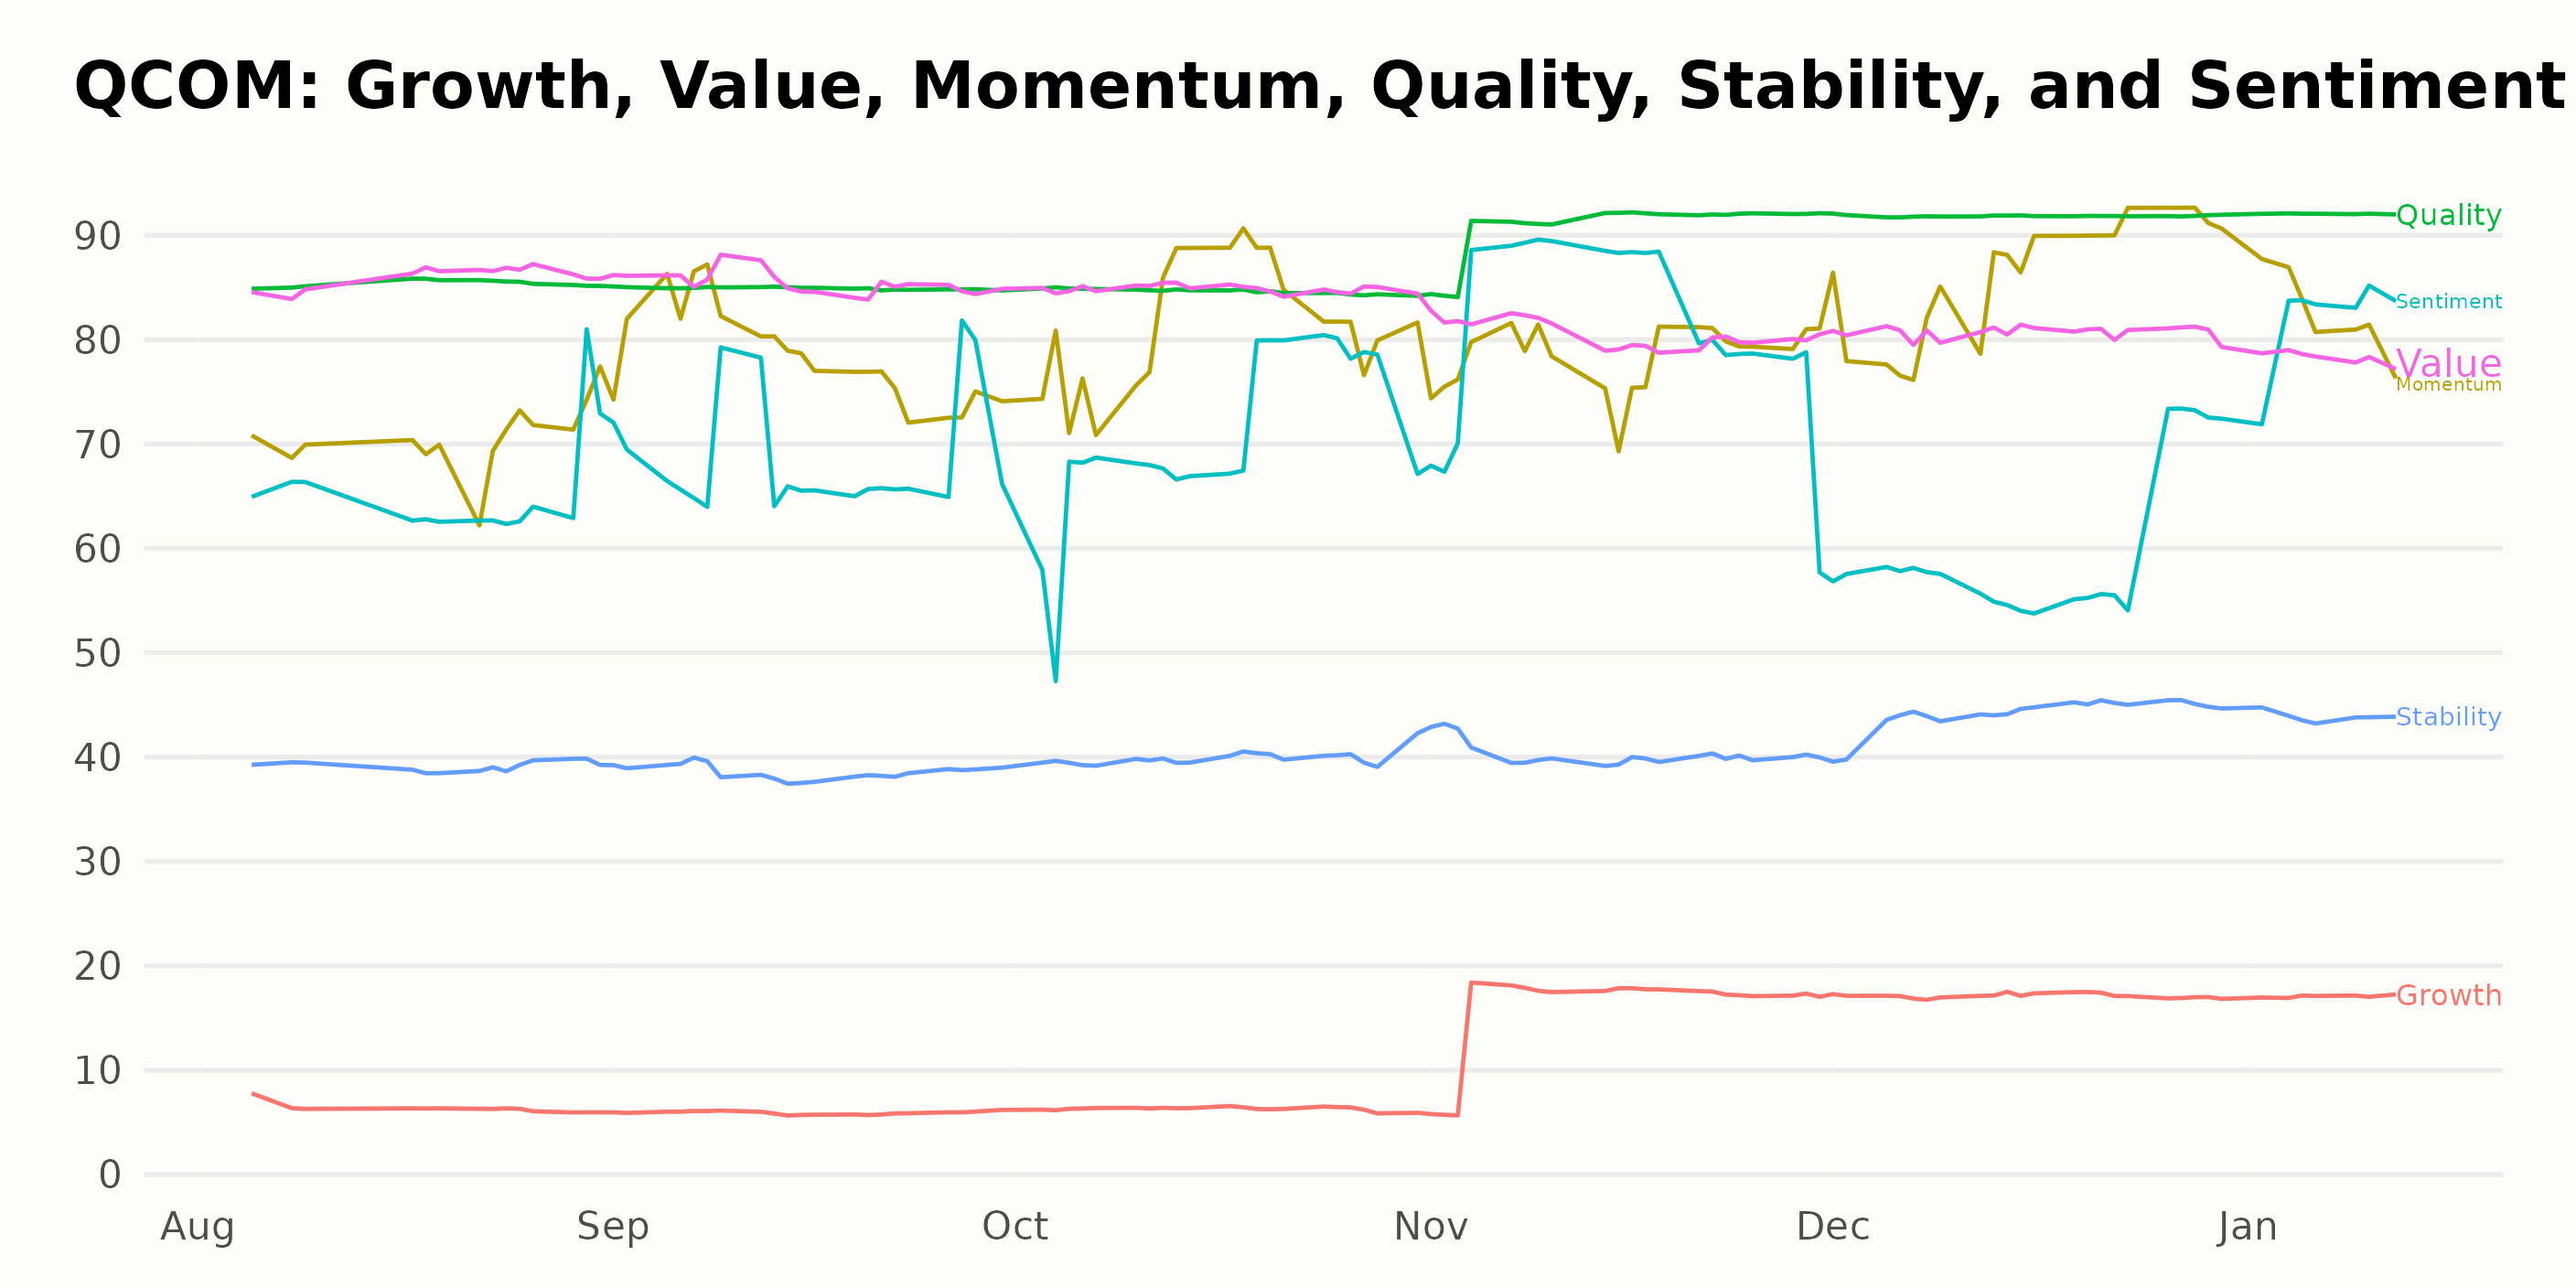
The three most noteworthy dimensions of the POWR Ratings for QCOM are Quality, Value, and Momentum.
Quality:
- In August 2023, QCOM had a Quality rating of 85.
- This value remained consistent through October 2023.
- However, by November 2023, the Quality score showed a rising trend, reaching 91.
- At the end of December 2023 and in January 2024, the Quality rating further increased and held steady at 92.
Value:
- The Value rating of QCOM was incredibly high in August and September 2023, both recorded at 86.
- It dropped slightly to 85 in October 2023 and maintained the score in the following month.
- In November and December 2023, the Value score declined modestly to 81.
- By January 2024, the Value rating underwent a further decrease to 78.
Momentum:
- In August 2023, the Momentum rating started at 71.
- The Momentum score portrayed a steady upward trend throughout the period.
- By September 2023, it increased to 78, and by October of that year, it further rose to 82.
- In November 2023, the Momentum rating went back to 78 but shot up again to 87 in December 2023.
- As of January 2024, the Momentum score reduced slightly to 83, though it was still significantly higher than the starting point.
How does QUALCOMM Incorporated (QCOM) Stack Up Against its Peers?
While QCOM has an overall B (Buy) rating, other stocks in the Semiconductor & Wireless Chip sector that may be worth considering are Photronics, Inc. (PLAB), ChipMOS TECHNOLOGIES INC. (IMOS), and Everspin Technologies, Inc. (MRAM) - they have an overall rating of A (Strong Buy). Click here to explore more Semiconductor & Wireless Chip stocks.
What To Do Next?
43 year investment veteran, Steve Reitmeister, has just released his 2024 market outlook along with trading plan and top 11 picks for the year ahead.
QCOM shares were trading at $142.09 per share on Thursday afternoon, down $6.42 (-4.32%). Year-to-date, QCOM has declined -1.76%, versus a 2.50% rise in the benchmark S&P 500 index during the same period.
About the Author: Anushka Dutta

Anushka is an analyst whose interest in understanding the impact of broader economic changes on financial markets motivated her to pursue a career in investment research.
The post QUALCOMM (QCOM): Decoding Earnings for Buy Signals appeared first on StockNews.com