
Verizon Communications Inc. (VZ) is set to write down $5.8 billion in the fourth quarter, reflecting an adjustment to the value of its dwindling wireline business. This downward adjustment impacts the financial forecast for Verizon's Business Unit. The wireline sector has felt the strain from intensifying competition, economic uncertainties, and a significant switch towards wireless services.
Notwithstanding surpassing analysts' adjusted earnings per share and revenue estimates for the third quarter, Verizon's business experienced a 4% revenue drop due to decreased revenue from wireline and wireless equipment.
Moreover, analysts predict a year-over-year decline in revenue and EPS of 2% and 9.1%, respectively, to $34.55 billion and $1.08 for the quarter ended December 2023.
Verizon's fourth-quarter earnings report is set to be released on January 23. Although Verizon continues to make strides in its 5G network expansion, this might not be the best time to invest in its stock. A more detailed examination of some key performance indicators could provide valuable insights.
Examining Verizon's Financial Performance: A Detailed Analysis from 2021-2023"
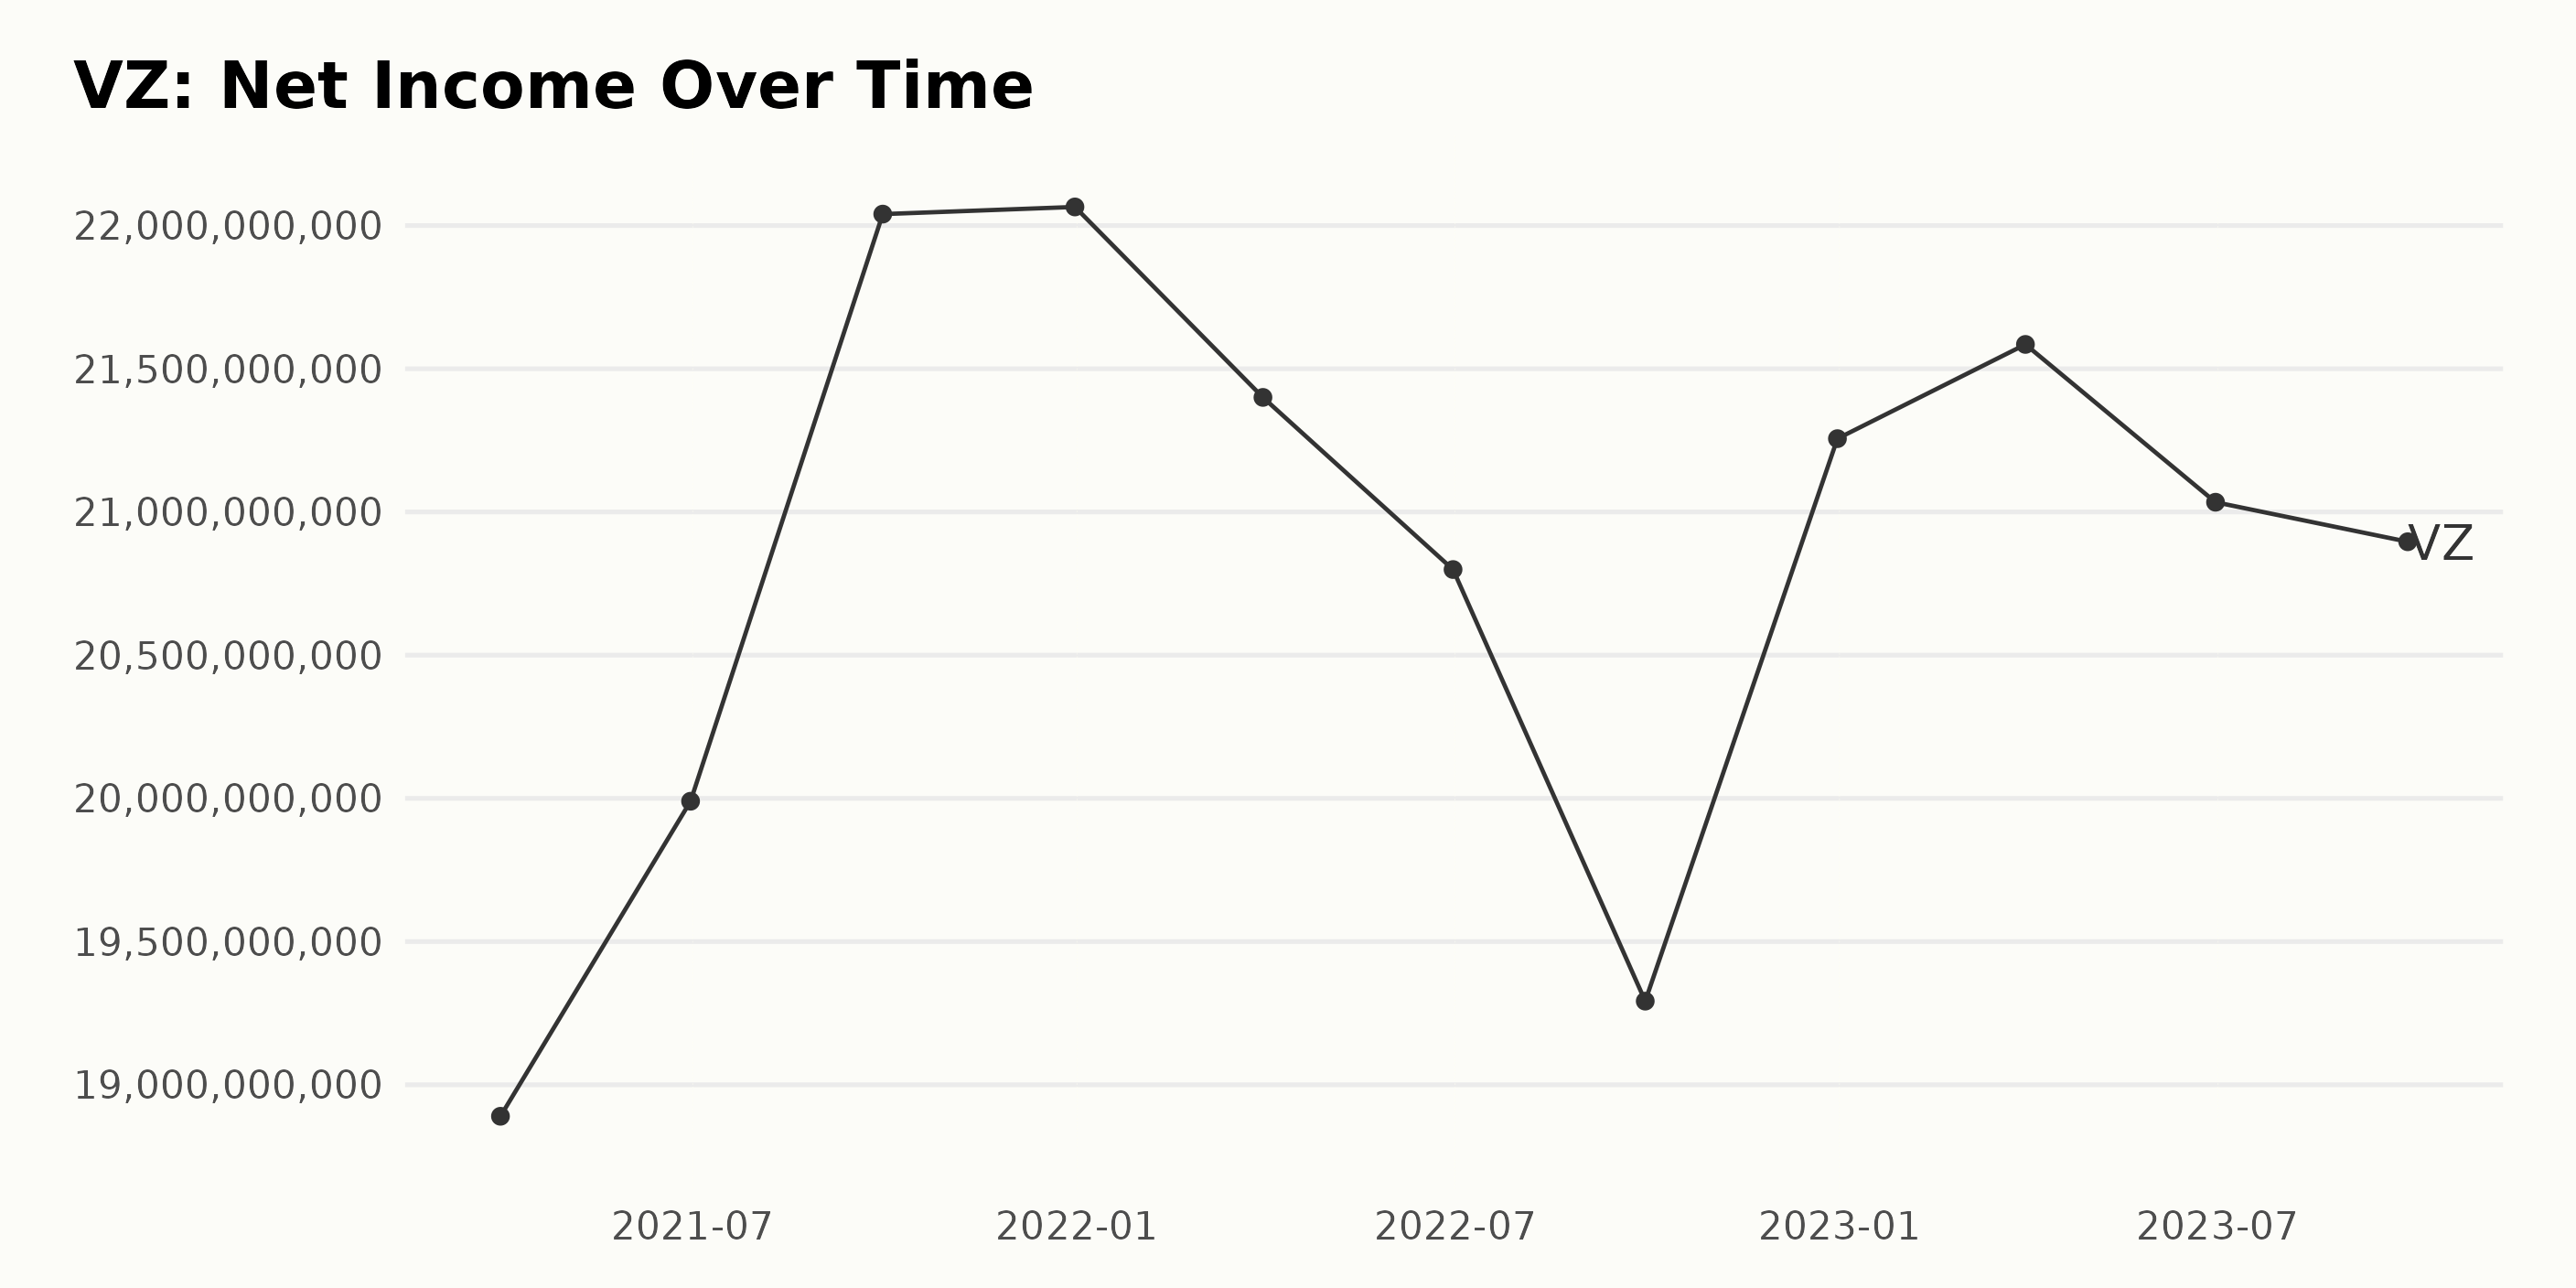
The trend of the trailing-12-month Net Income of VZ has been notably irregular over time, albeit tending to fluctuate within a certain range. Here is a summary of key periods:
- On March 31, 2021, the Net Income was $18.89 billion.
- The figure rose quite steadily for the rest of the year, peaking at $22.06 billion on December 31, 2021.
- However, this rise didn't continue into 2022. There was a dip in the first half of the year, with the Net Income decreasing to $20.8 billion by June 30, 2022.
- This was followed by another decline to $19.29 billion by September 30, 2022 before recovering slightly to end the year at $21.26 billion at the end of December.
- In 2023, the Net Income started at a relatively high level of $21.59 billion in March before decreasing again, sitting at $20.9 billion in June.
- The most recent data, as of September 30, 2023, show a slight increase to $20.9 billion.
Measured from the first value to the last, the growth in VZ's Net Income is approximately 10.6%. Notwithstanding this overall growth, it's worth highlighting the relative instability of this figure, with numerous periods of both increases and decreases over the observed timespan. This suggests potential volatility or cyclicality in Verizon's net income.
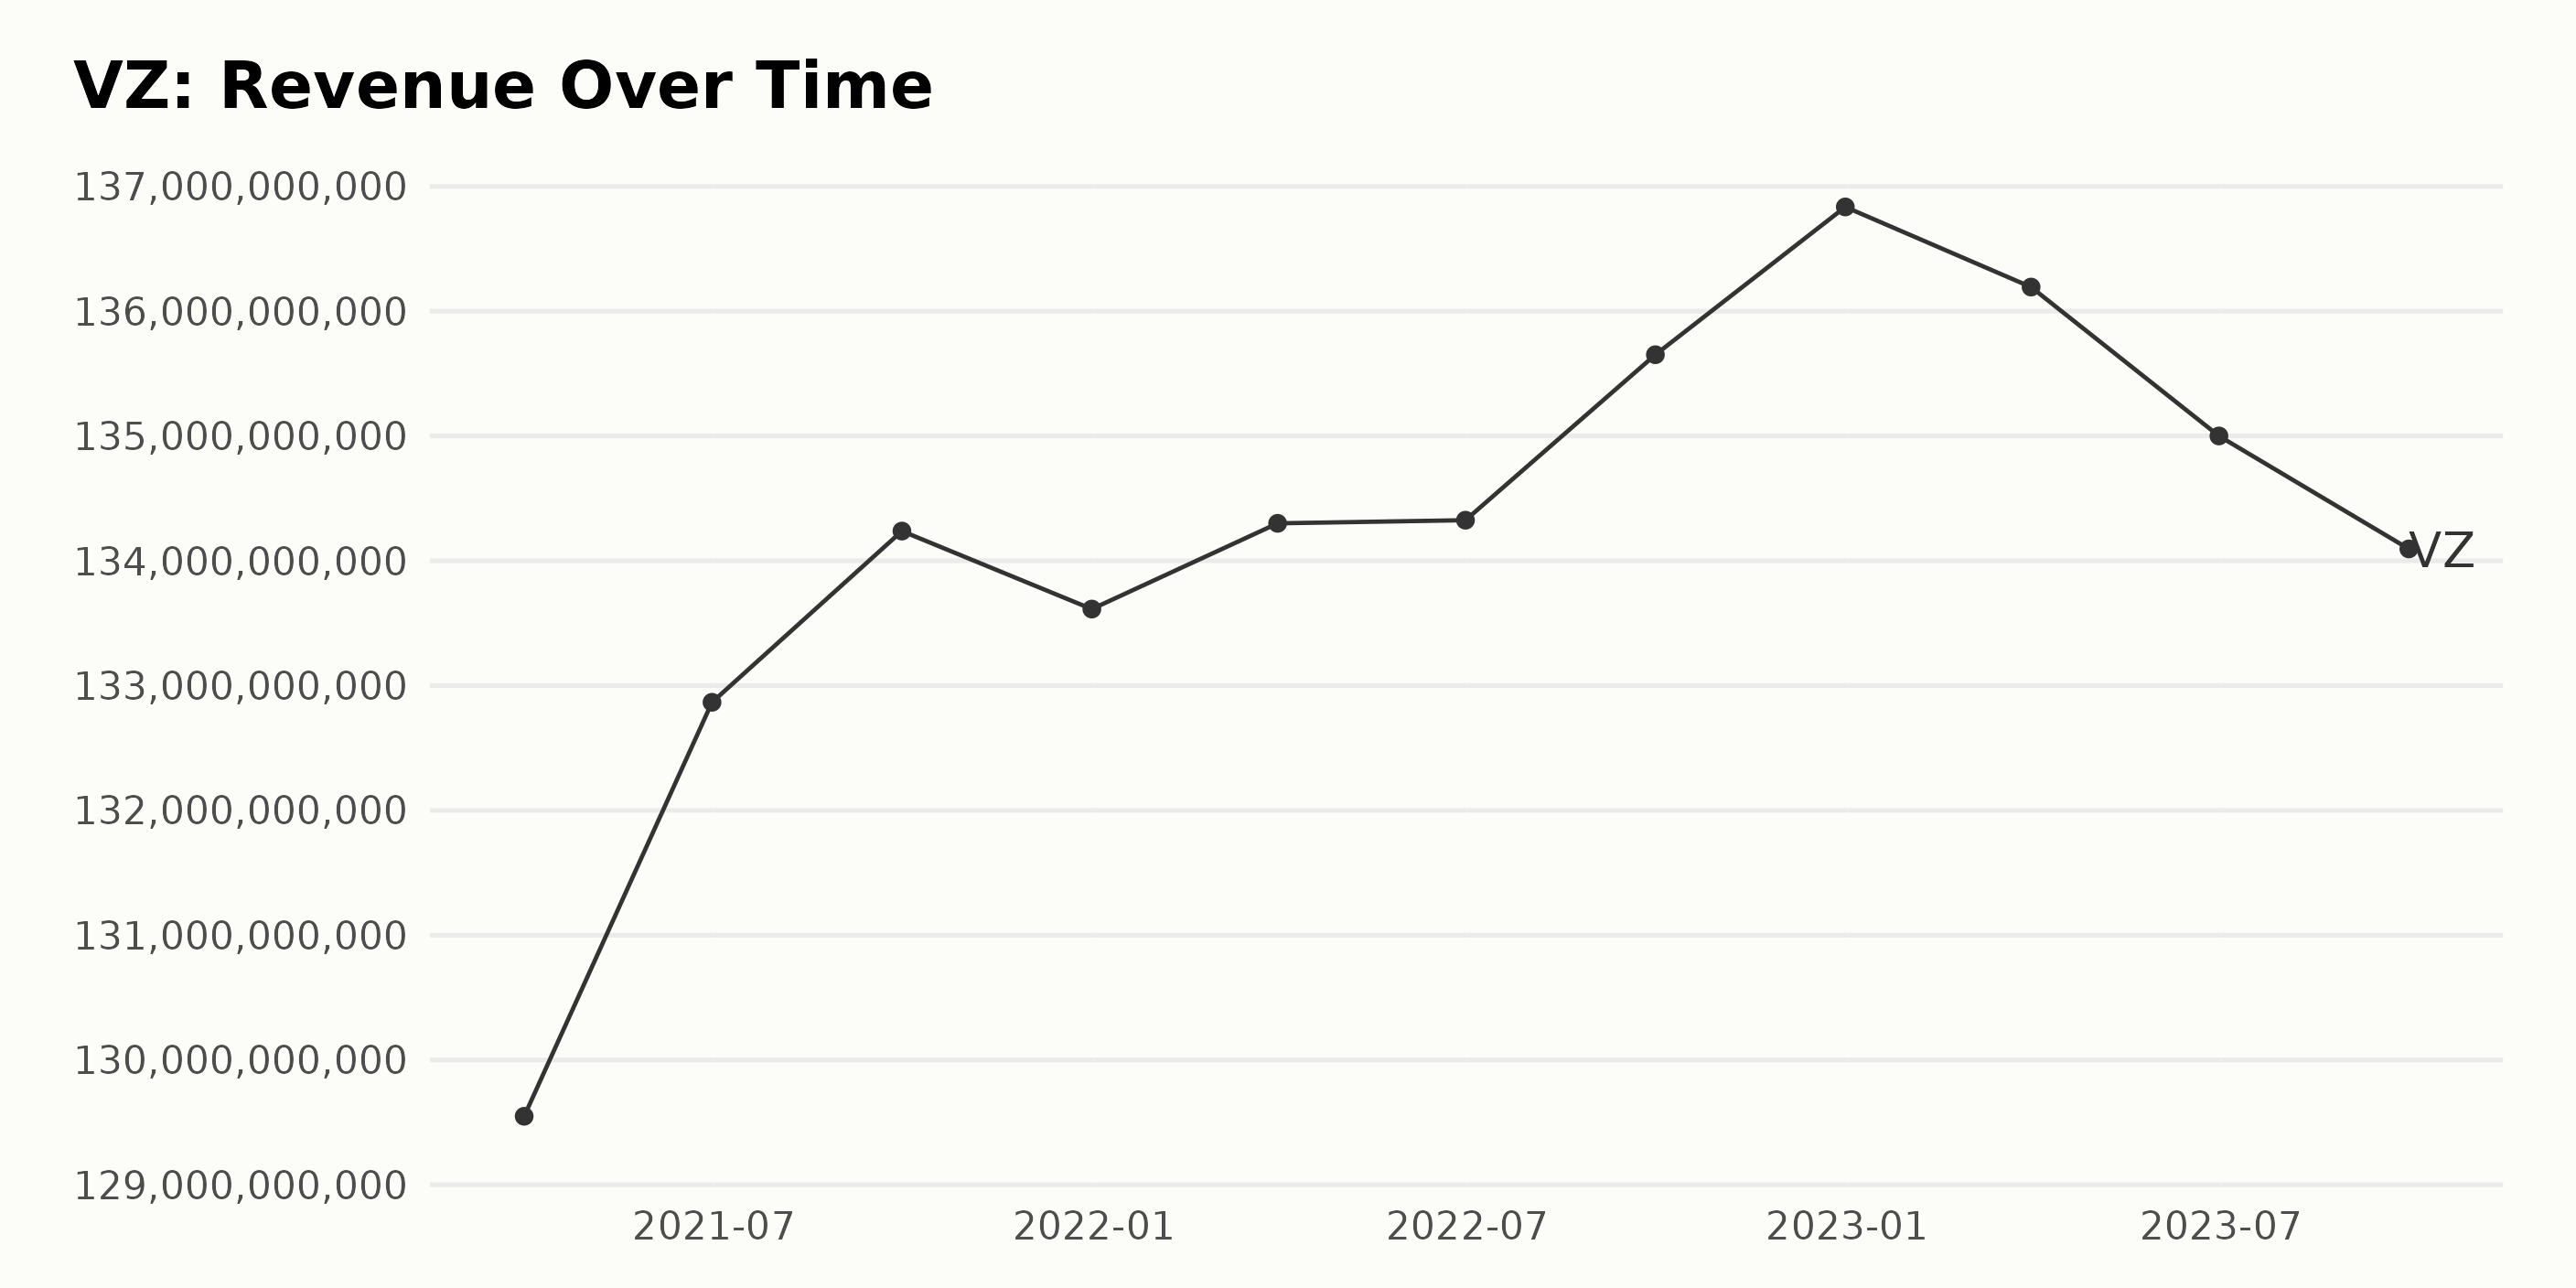
The trend in the trailing-12-month Revenue for VZ shows a steady but mild growth over the observed period, from March 2021 through September 2023.
- Looking back to March 2021, we see that Verizon's Revenue was around $129.55 billion.
- The company's Revenue experienced some fluctuations but mostly walked upward and peaked at $136.83 billion in December 2022.
- Notably, there's a slight downtick moving into 2023 with VZ’s Revenue decreasing since December 2022, reaching $134.1 billion as of September 2023.
It's important to highlight that the overall growth rate from March 2021 ($129.55 billion) to September 2023 ($134.1 billion) is about 3.52%. In summary, while the Revenue of Verizon Communications Inc. (VZ) has displayed mild fluctuations over the course of time, the overarching revenue trend for the firm points towards modest growth. Though it's crucial to note that the most recent data indicates a slight downturn. As always, these trends should be contextualized in broader industry and economic developments.
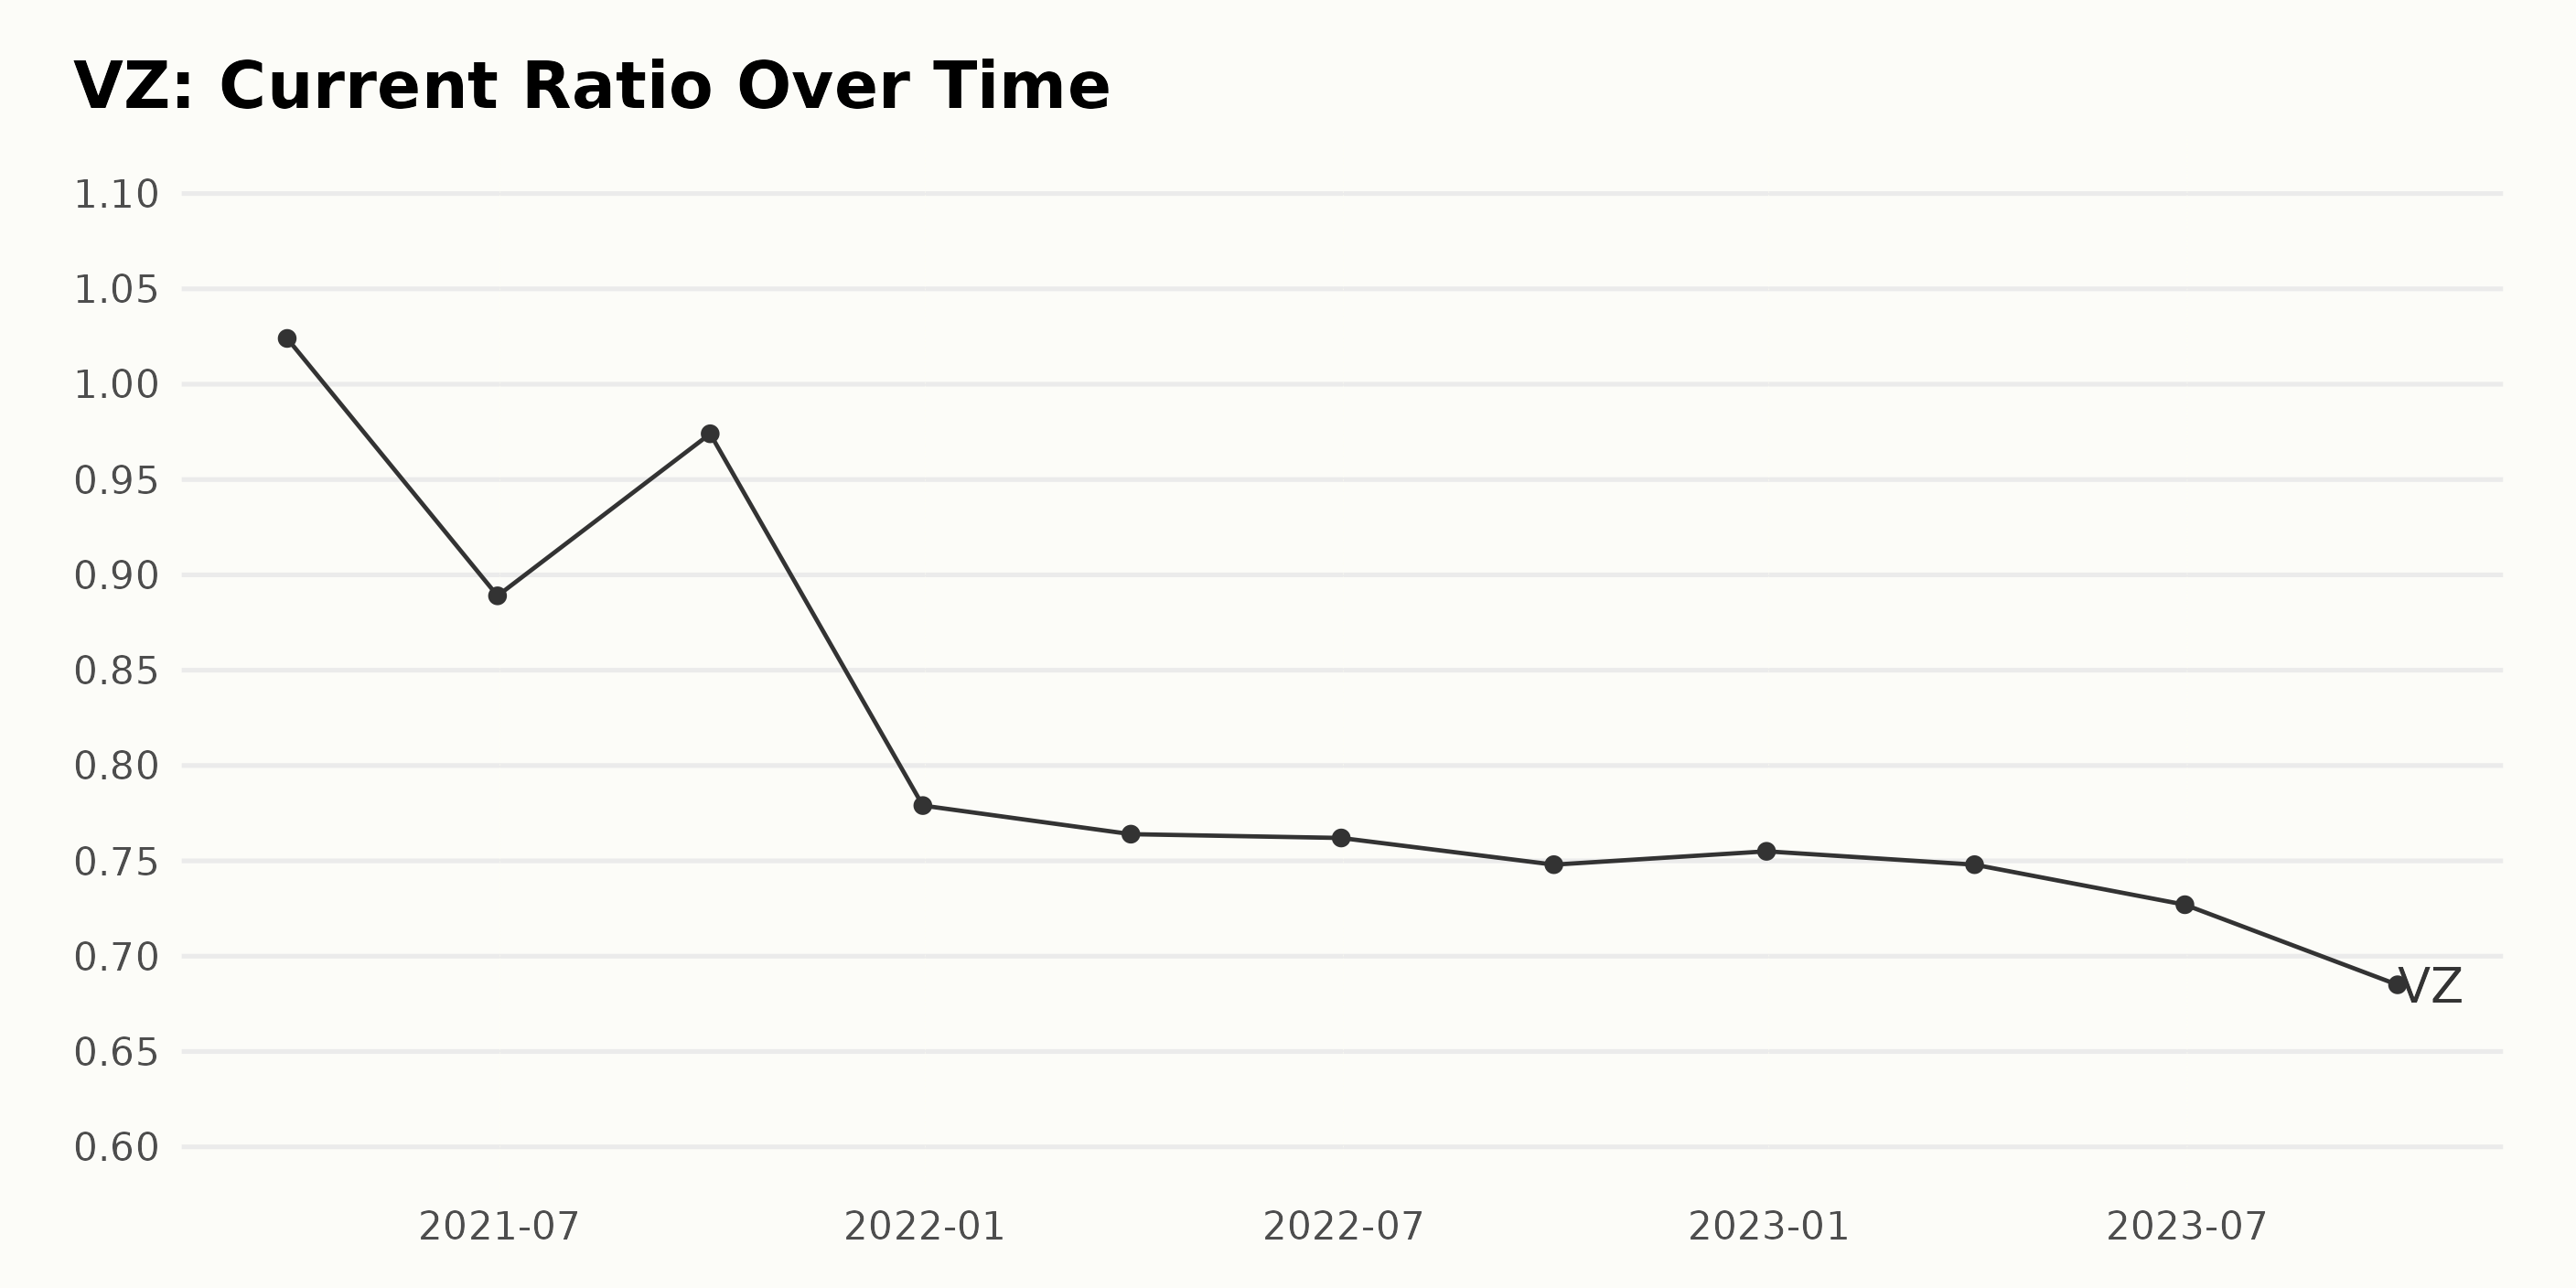
The Current Ratio of VZ has shown a general downward trend from 2021 to 2023.
- At the start of this period, on March 31, 2021, VZ's Current Ratio was at 1.02.
- Nevertheless, there has been fluctuations within the year, with the Current Ratio dropping to 0.89 in June 2021 and rebounding to 0.97 by the end of September 2021.
- By the end of 2021, the Current Ratio had dropped significantly, reaching 0.78 as of December 31, 2021.
Moving into 2022, the declining trend continues.
- The Current Ratio slightly decreased to 0.76 in March, and virtually remains stagnant at 0.762 in June 2022.
- The close of September 2022 sees the Current Ratio diminishing slightly to 0.75, and making a slight rise to 0.755 at the end of December 2022.
Throughout 2023, the downward trend persists, with no significant upticks.
- March 2023 records a Current Ratio of 0.748 while June 2023 lowers to 0.727.
- As of the latest data point, on September 30, 2023, the Current Ratio sits at 0.685, marking a grand total decrease by approximately 33.33% from its initial value in 2021.
In summary, the overall trend in Verizon Communications Inc.'s Current Ratio from March 2021 to September 2023 is one of decrease, with minor fluctuations envisaged within the years.
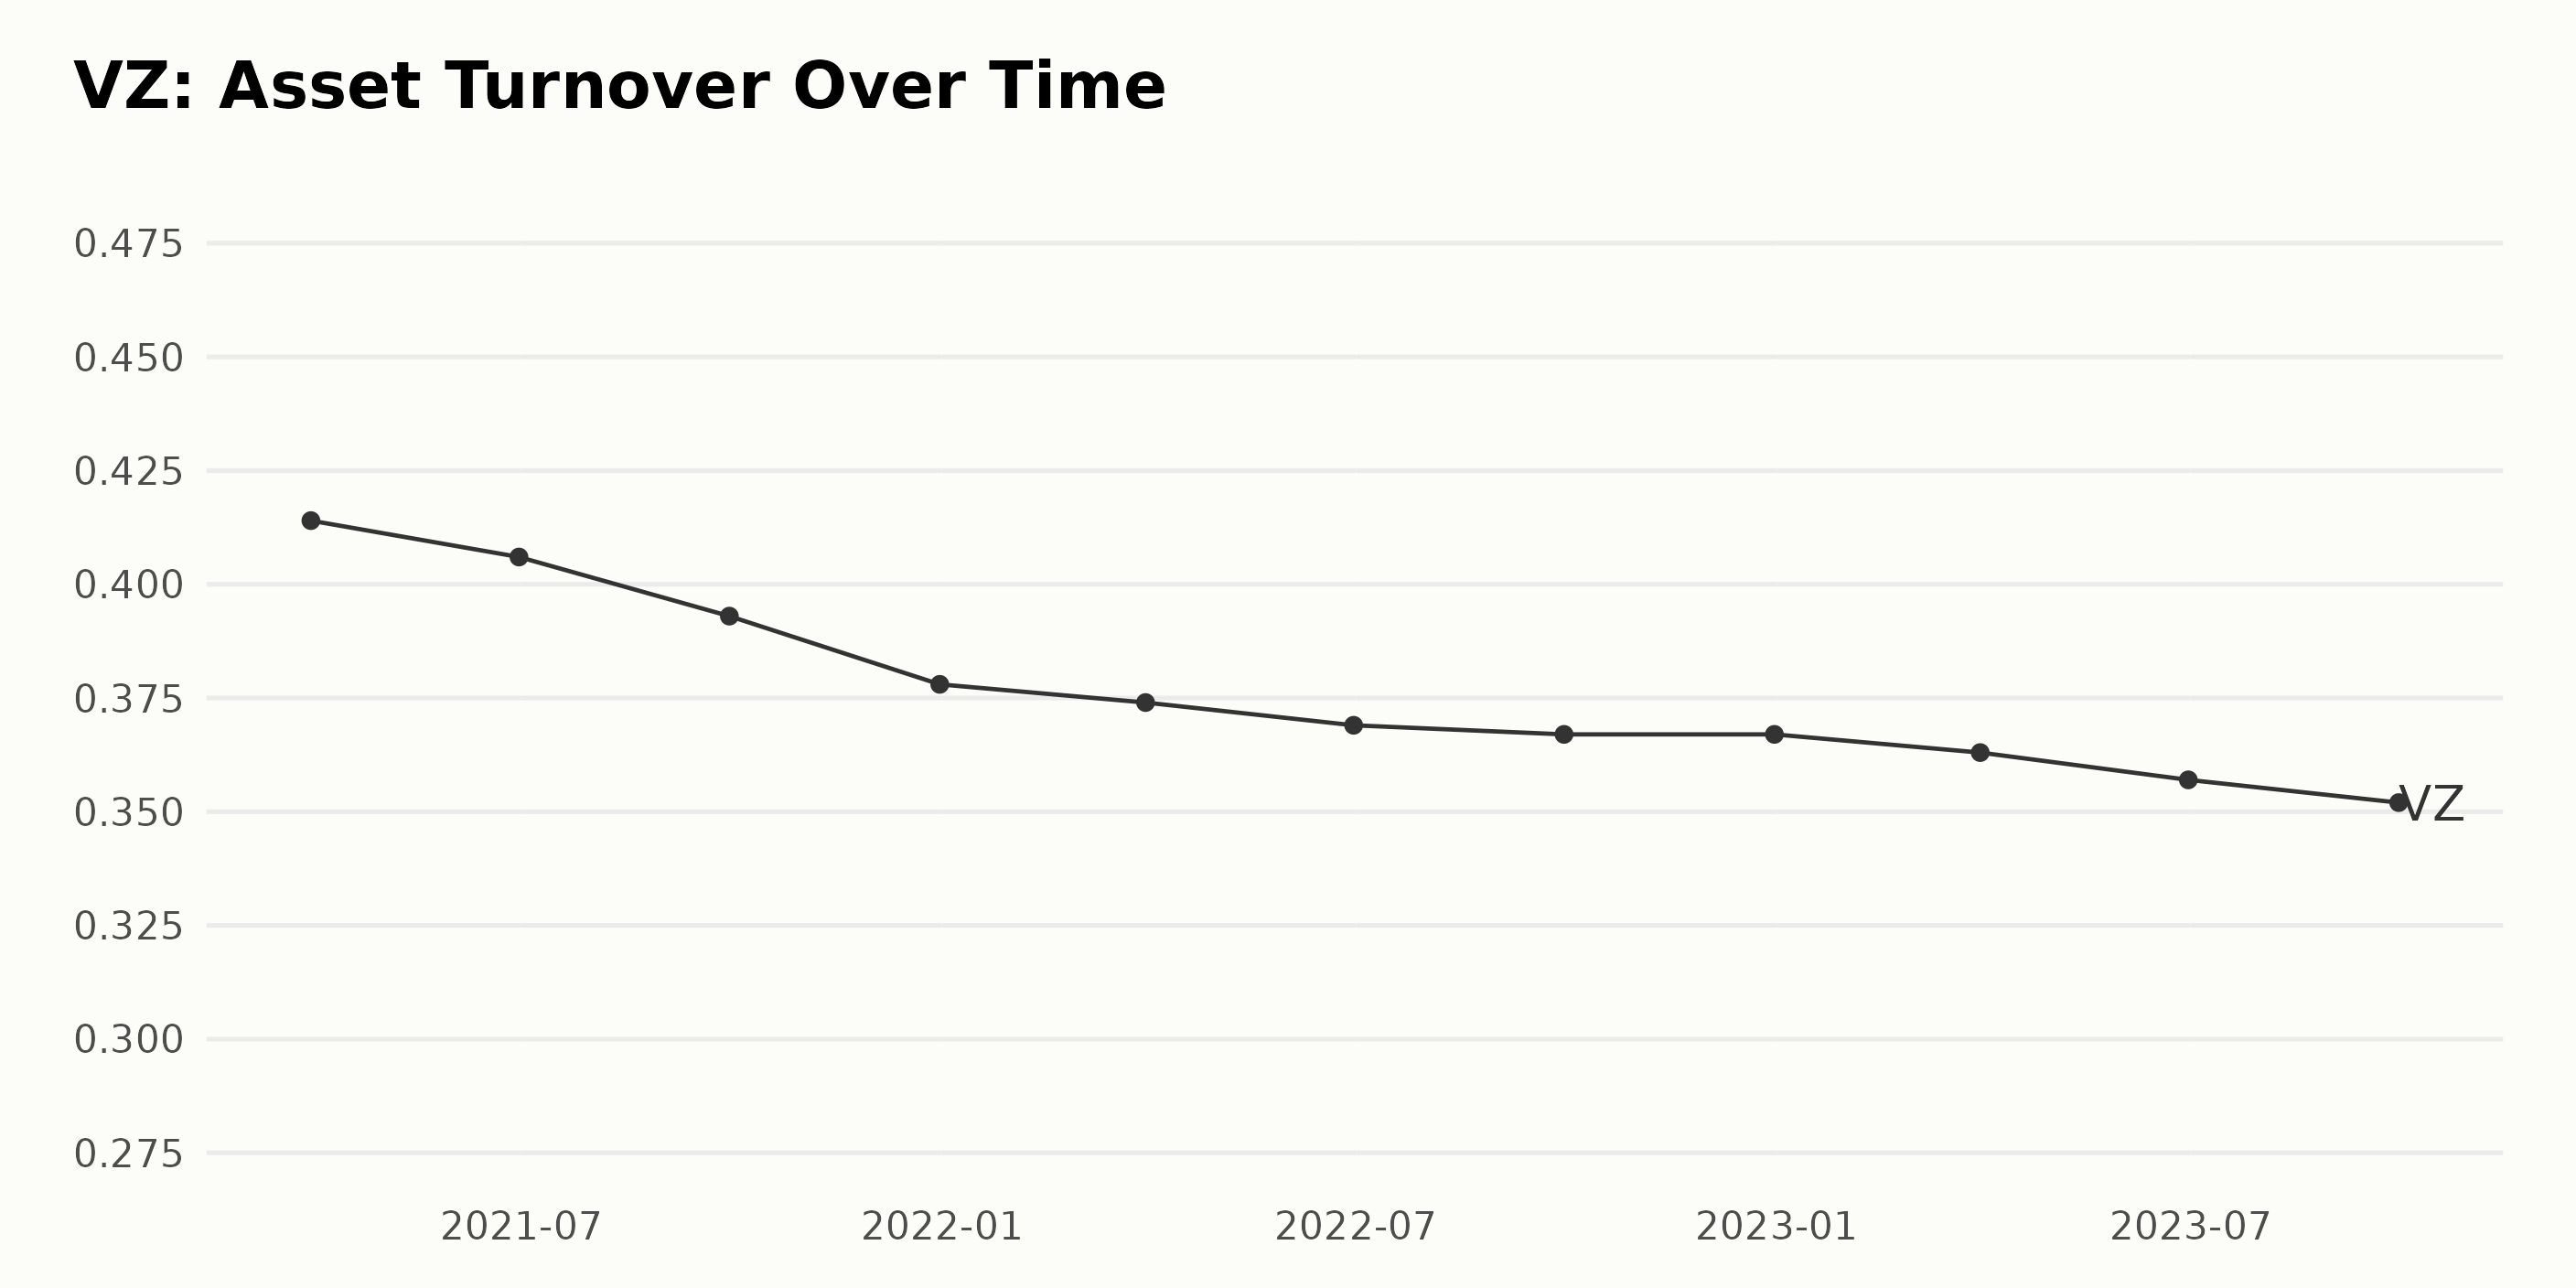
The data presents the Asset Turnover of VZ from March 2021 to September 2023. Here are some key observations:
Overall Trend: There is a noticeable downward trend in Verizon's Asset Turnover over the reviewed period. Starting from 0.414 in March 2021, it steadily decreases over time to reach 0.352 by September 2023.
Fluctuations: Although the trend is generally downward, there are fluctuations. For example, the decrease between quarters slightly accelerated towards the end of 2021. After that, from the start of 2022, the quarterly decrease slows down a bit and stabilizes more or less around 0.367 for two quarters (December 2022 and March 2023). Then, it continues its descent through June 2023 and September 2023, reaching the lowest point of 0.352.
Recent Data Emphasis: Looking at the recent figures, the Asset Turnover value remains fairly consistent at 0.367 from December 2022 through March 2023. However, by June and September 2023, this value sees a reduction to 0.357 and 0.352, respectively.
Growth Rate Calculation: Comparing the first value (0.414 in March 2021) and the last value (0.352 in September 2023), the Asset Turnover has decreased by approximately 15% over this period. This overall analysis suggests that Verizon has become less efficient in using its assets to generate revenue over the observed period. The reasons behind this trend may require further investigation.
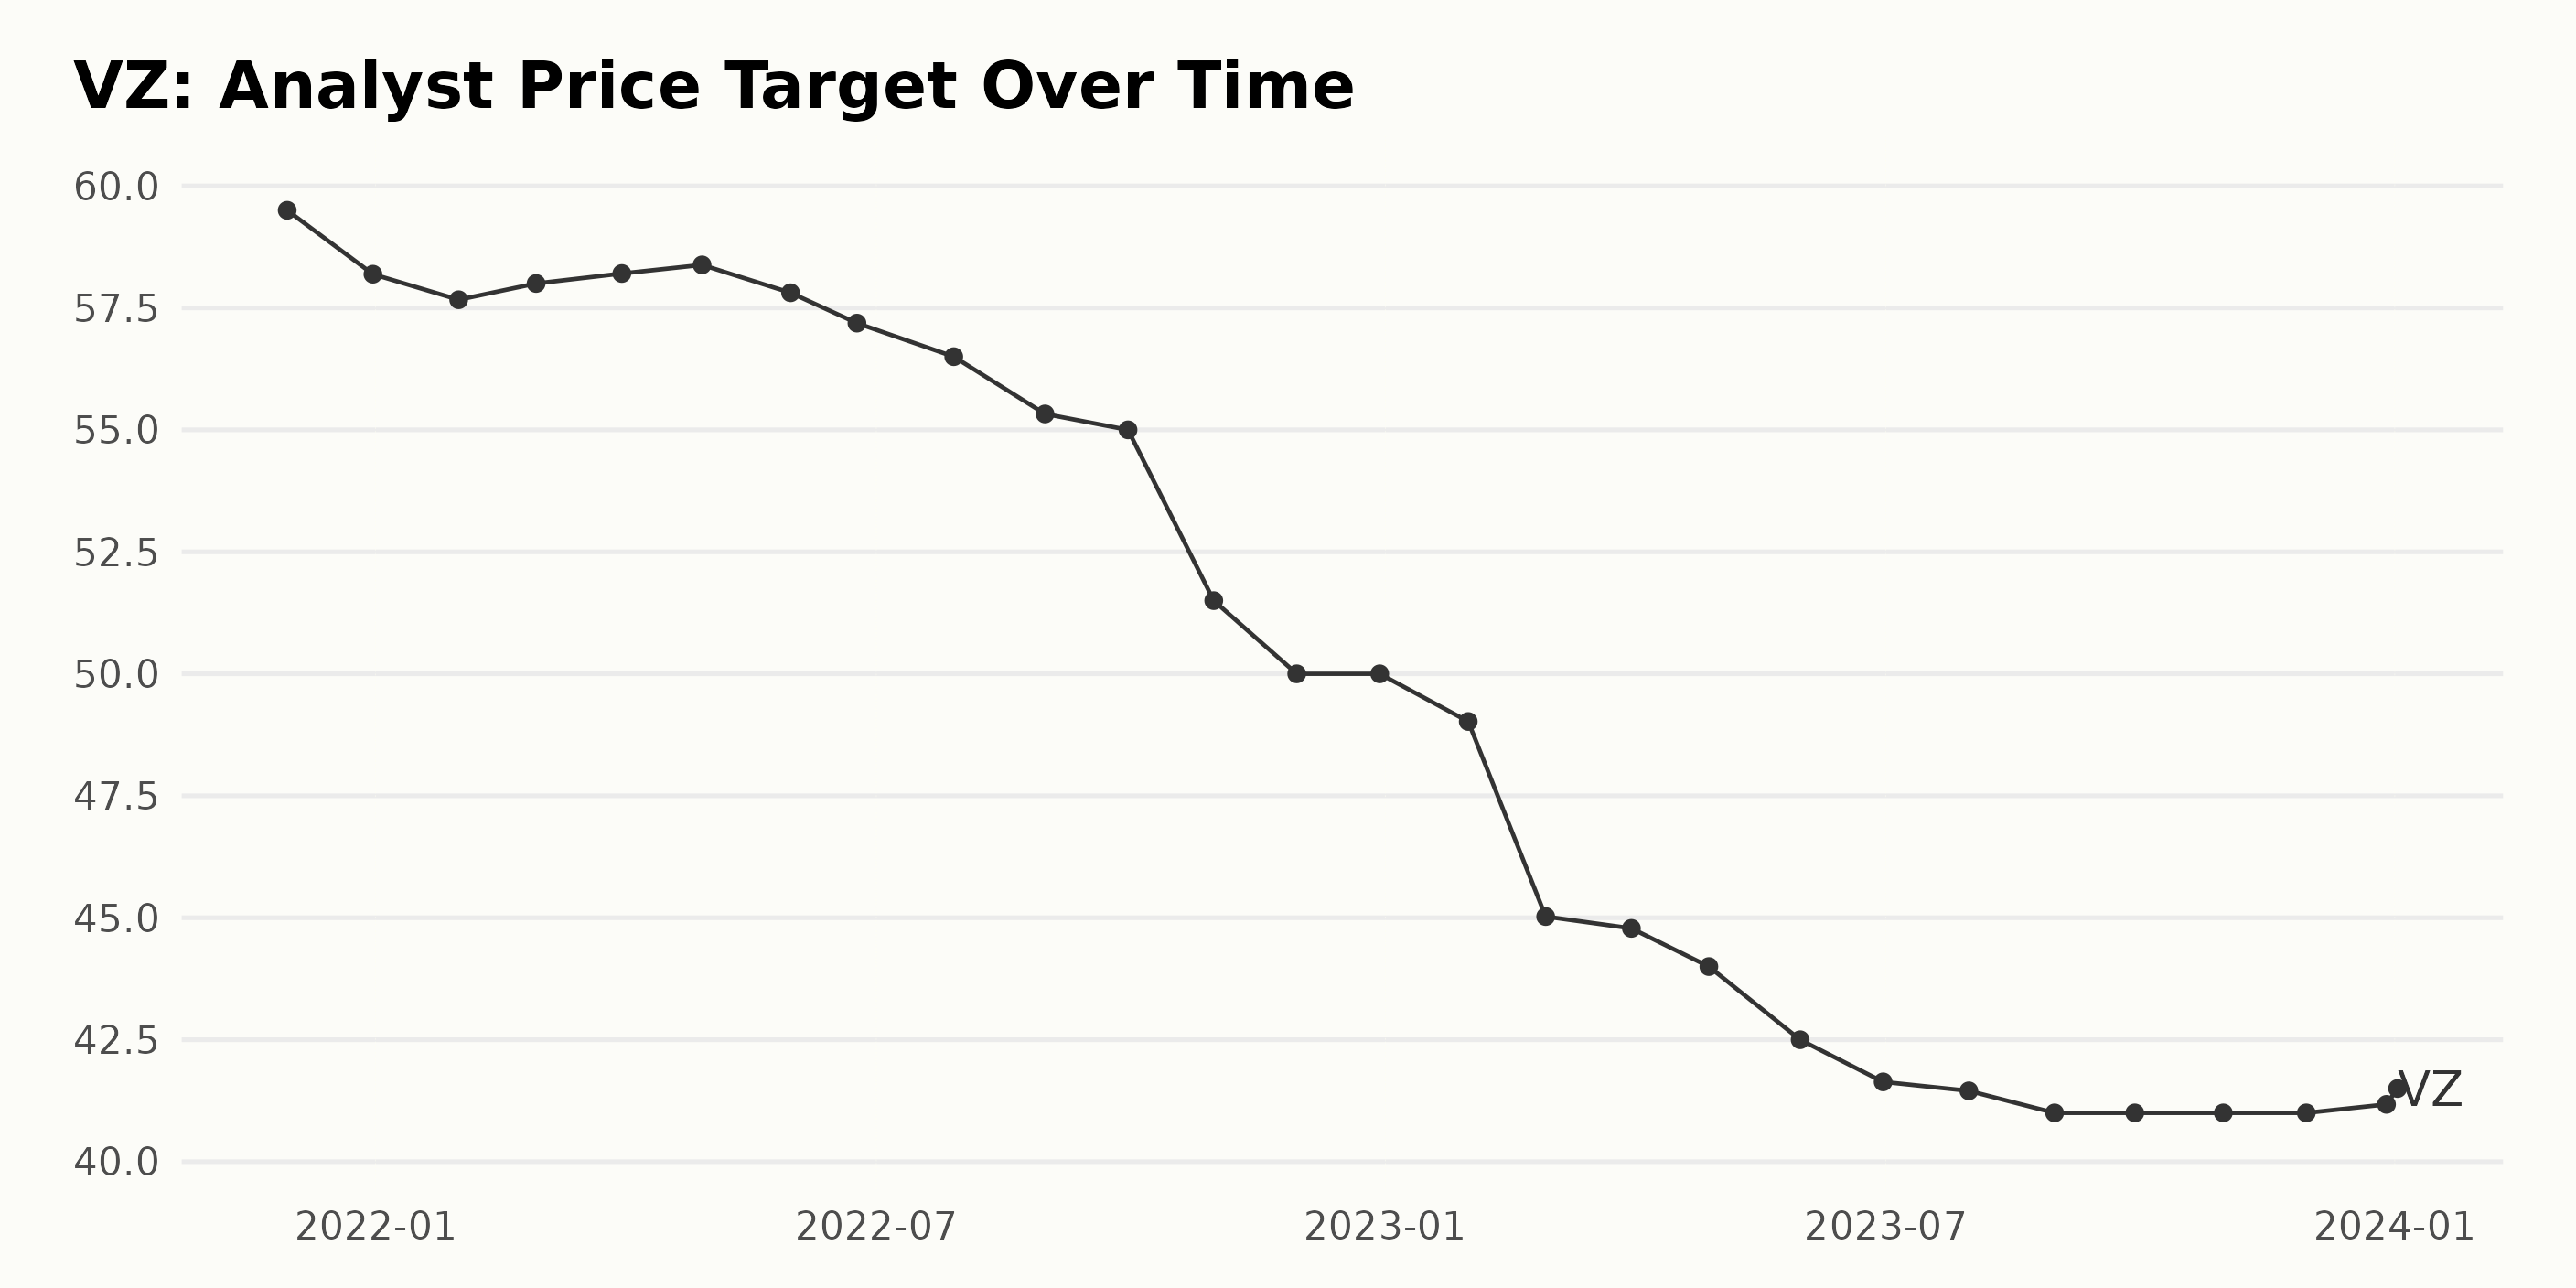
The reported Analyst Price Target of VZ shows a general downward trend over the period from November 2021 to January 2024.
- Starting from $59.50 in November 2021, the price target decreased to $41.50 by the end of January 2024.
- Notable fluctuations happened several times throughout this interval. For example, between May to June 2022, the price target dipped noticeably from $57.80 to $57.18. Another substantial drop occurred between October and November 2022 when the price target fell from $51.50 to $50.00.
- From early 2023, the price decelerated even further. At the end of January 2023, the value was $49.02, which steadily declined to $41.00 in August 2023. Between September and November 2023, the price remained stable at $41.00.
- As of January 2024, the latest price target for VZ stands at $41.50, slightly above the lowest value of $41 recorded from August to November 2023.
The overall growth rate, calculated by measuring the last value from the first, indicates a decrease by approximately 30%. While the price target has experienced substantial declines during this period, it is worth noting that recent values show slight signs of recovery with slight uplift from December 2023 to January 2024. Given this, financial analysts may have slightly improved predictions about the future performance of Verizon Communications Inc.
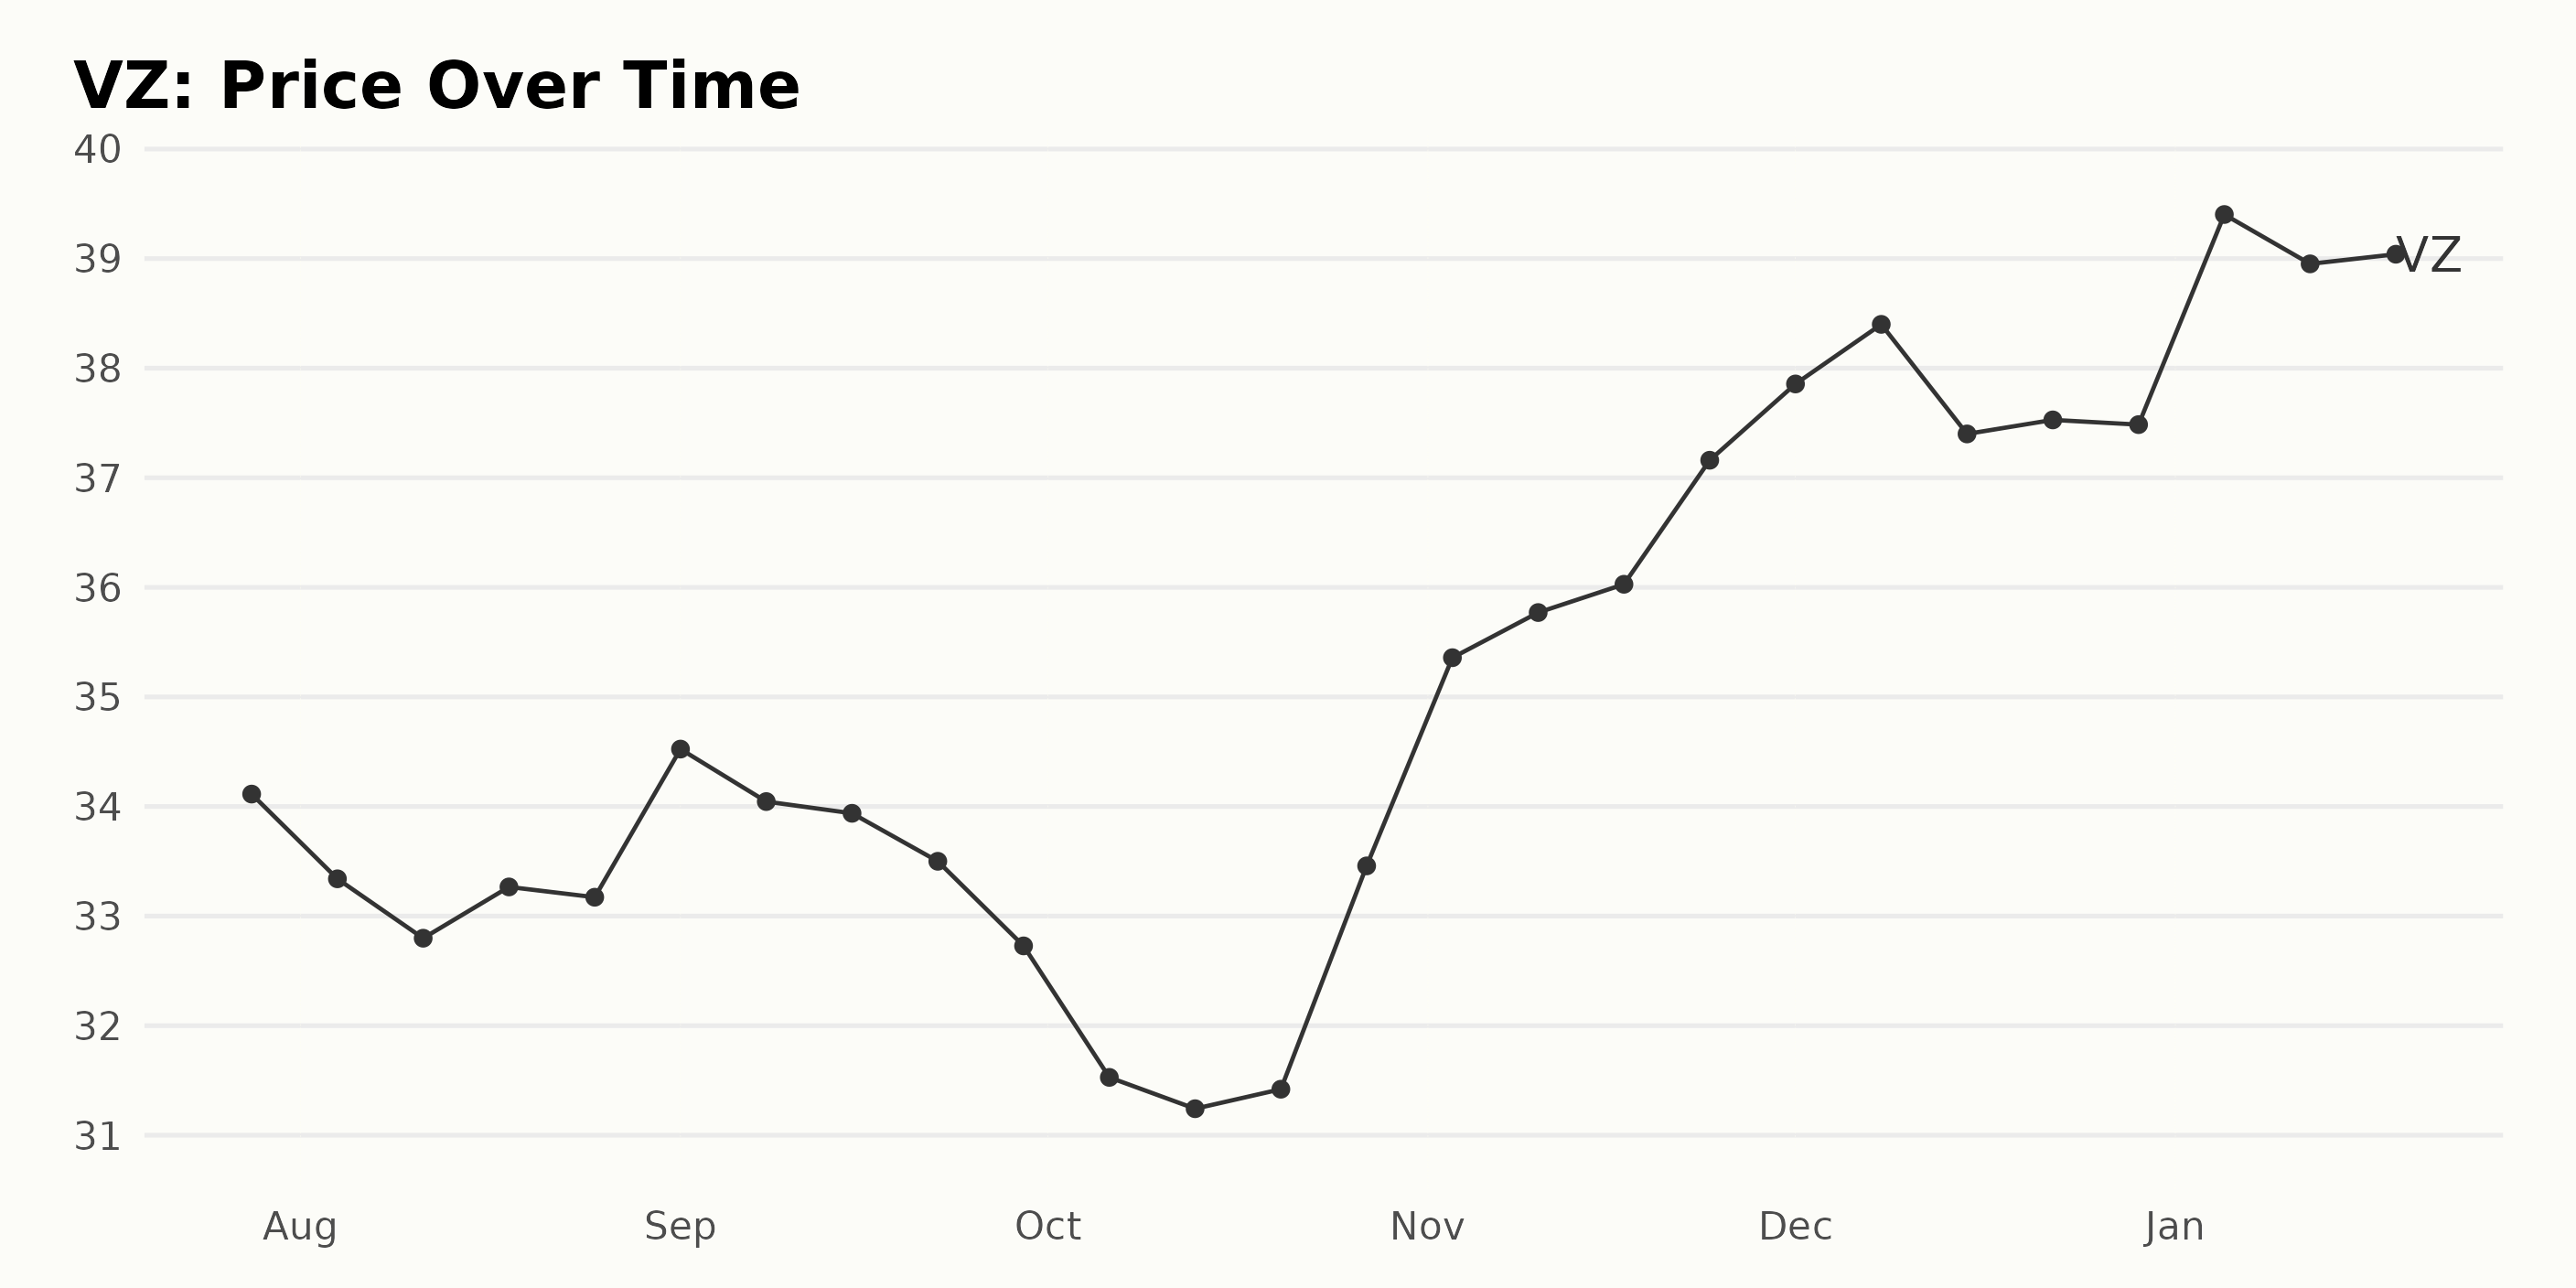
Analyzing Verizon's Stock Price Fluctuations: July 2023 to January 2024
The general trend for the share price of Verizon Communications Inc. (VZ) from July 2023 to January 2024 indicates a pattern of fluctuation, with several noticeable and significant changes.
- From July 28, 2023 ($34.11) to August 25, 2023 ($33.17), the stock shows a subtle decrease.
- There is a brief increase till September 1, 2023 closing at $34.52, followed by a gradual decrease reaching a minimum value of $31.24 on October 13, 2023.
- Thereafter, from October 20, 2023 ($31.42), there is a consistent and accelerating upward trend through December 8, 2023 ($38.4).
- A slight dip ($37.4) is observed on December 15, 2023, followed by a plateau until December 29, 2023 ($37.48).
- Finally, from January 5, 2024, the price starts increasing again, closing at $39.04 on January 19, 2024.
In terms of growth rate, the period of August to October witnessed a slowdown with the lowest point reached in October. However, a pronounced growth acceleration occurred between October 20, 2023, and December 8, 2023, resulting in a peak for the year's share price. After a minor deceleration in mid-December, prices remained fairly stable till the end of the year. The new year then sees another rapid acceleration in prices. Here is a chart of VZ's price over the past 180 days.
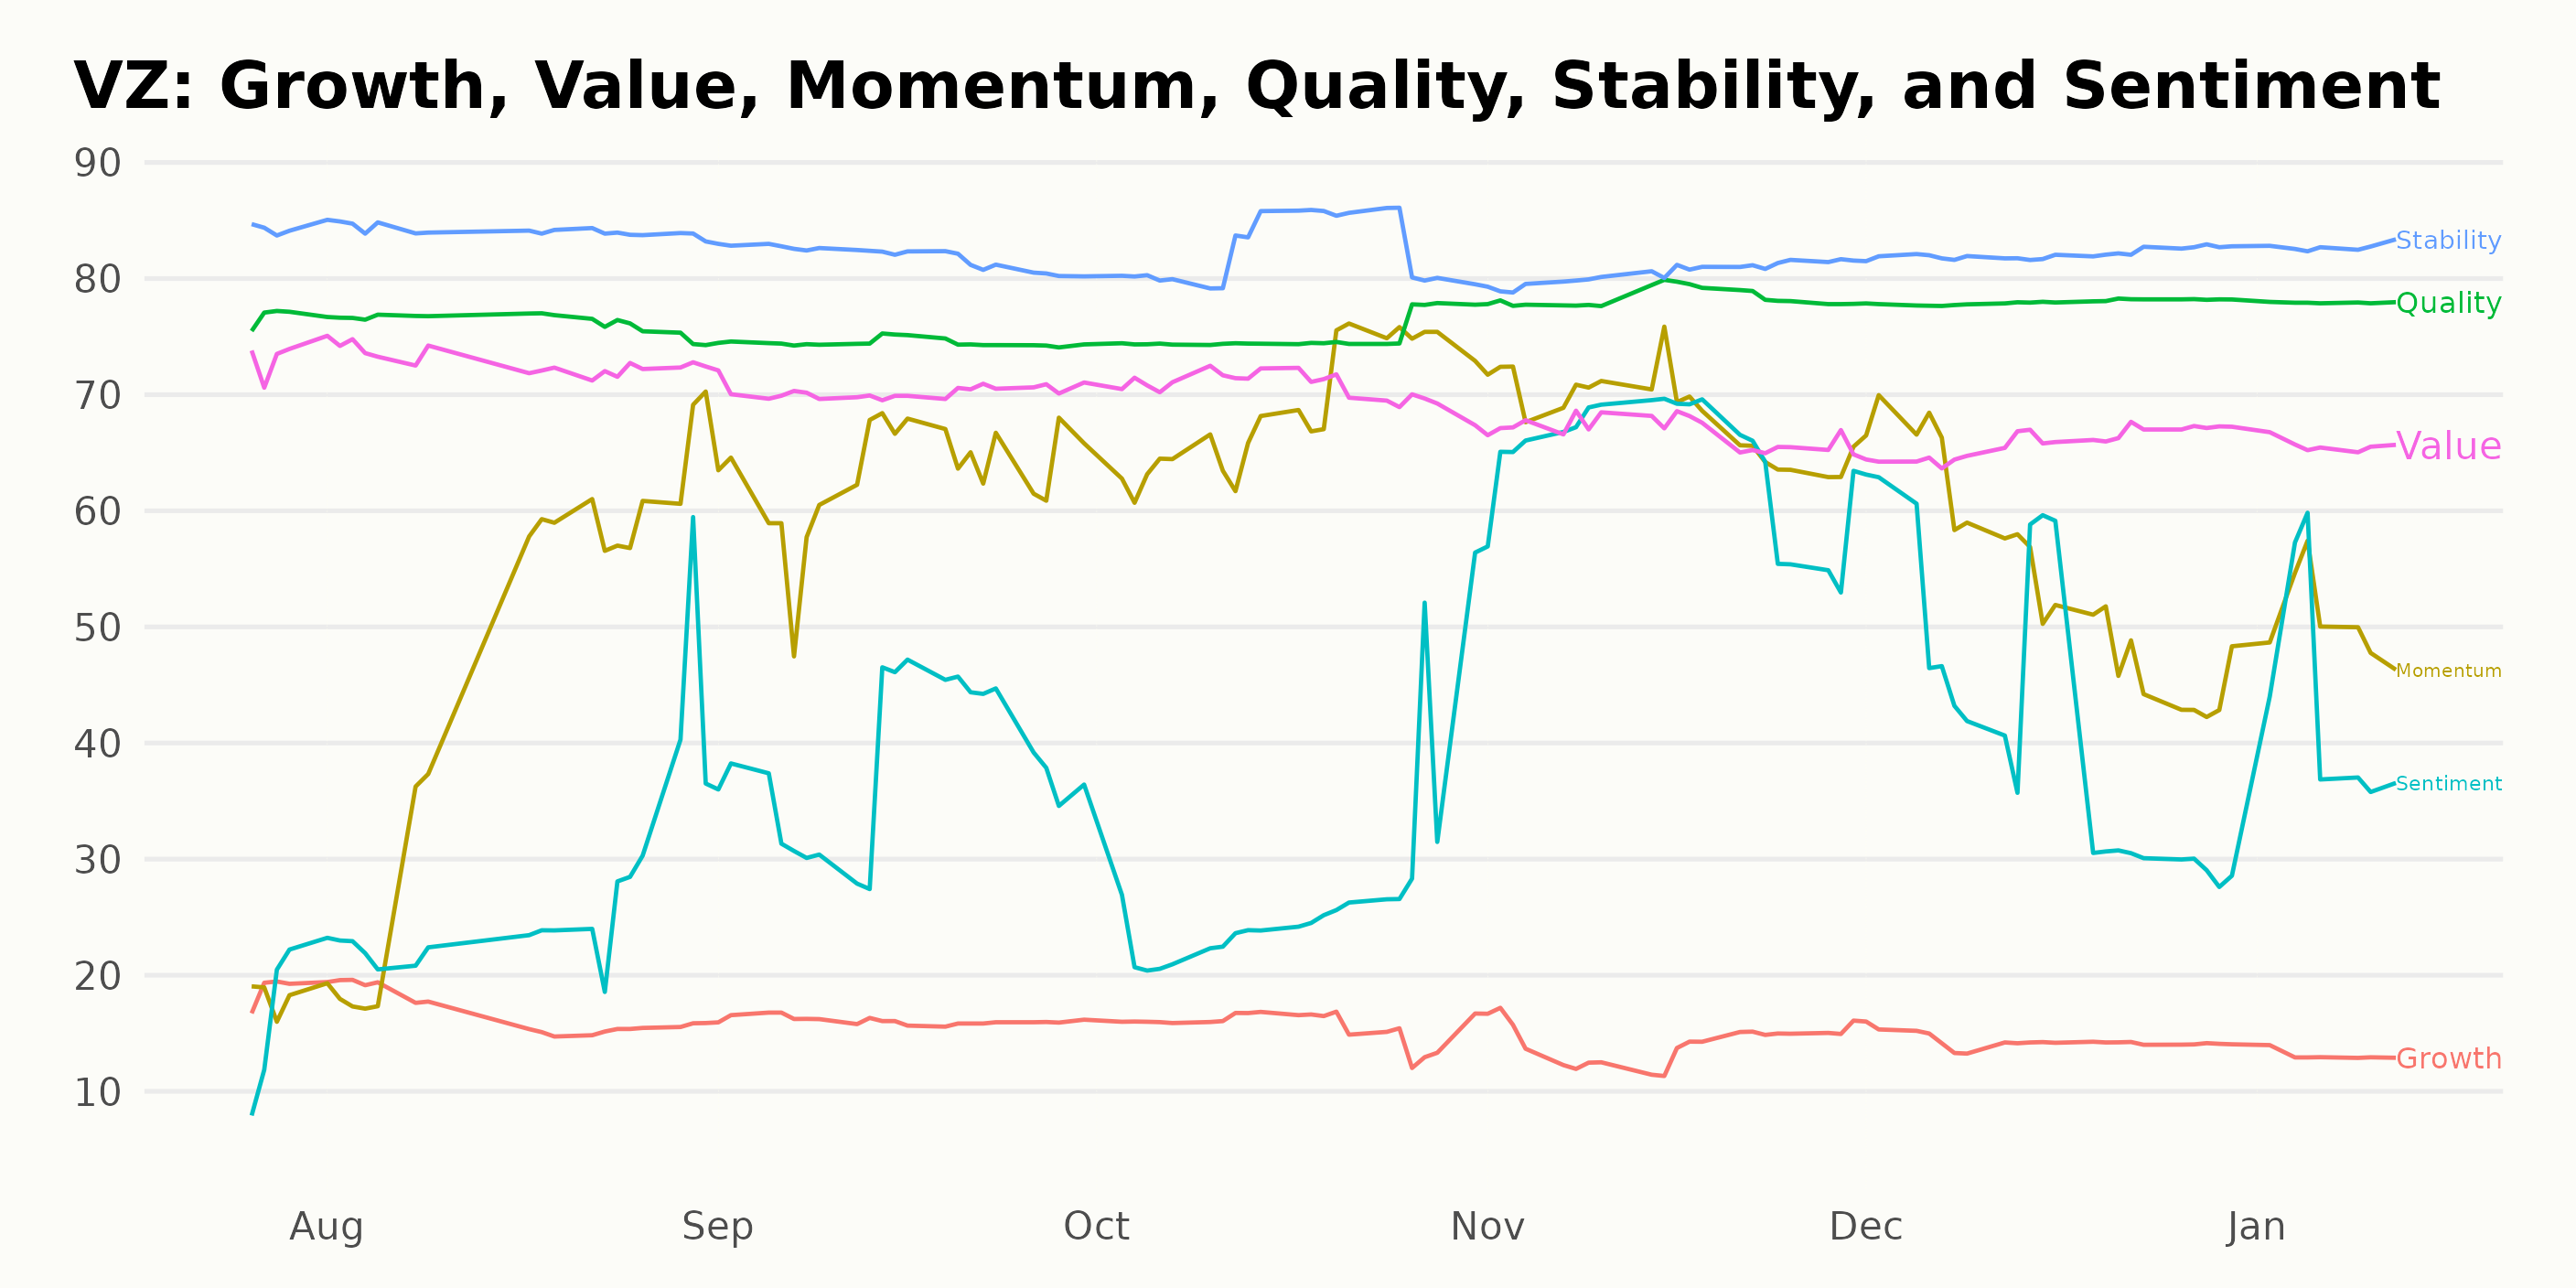
Analysis of Verizon's POWR Ratings: Stability, Quality, and Value Examined
VZ has an overall C rating, translating to a Neutral in our POWR Ratings system. It is ranked #4 out of the 17 stocks in the Telecom - Domestic category.
After analyzing the POWR Ratings for VZ, it's clear that three dimensions in particular are noteworthy: Stability, Quality, and Value.
Stability: This dimension has consistently held the highest ratings over time, suggesting that it is a key strength for VZ.
- In July 2023, it scored an impressive 84.
- This remained consistent in August of the same year, and decreased slightly to 82 by September 2023.
- The stability rating remained at 82 in both October and December of 2023 and increased to 83 in January of the following year.
Quality: Another dimension with high ratings is quality. Although there were slight fluctuations, the overall values remained high throughout the observed period.
- Verizon marked a quality rating of 77 in July 2023.
- There was a minor reduction to 76 in August and it further decreased to 74 by September 2023.
- The quality score saw an increase to 78 by November 2023, which was maintained into January 2024.
Value: The third noteworthy dimension is value, which illustrates a decreasing trend in the observed timeframe.
- A high value score of 73 was observed in July and August 2023.
- However, this decreased to 70 by September 2023 and the downward trend continued, reaching 66 by December 2023, which remained the same in January 2024.
In summary, over the observed period, stability and quality continue to be the strongest dimensions for Verizon Communications Inc., while the value dimension indicated a decreasing trend.
How does Verizon Communications Inc. (VZ) Stack Up Against its Peers?
Other stocks in the Telecom - Domestic sector that may be worth considering are Ooma Inc. (OOMA), Spok Holdings Inc. (SPOK), and InterDigital Inc. (IDCC) -- they have better POWR Ratings.
What To Do Next?
Discover 10 widely held stocks that our proprietary model shows have tremendous downside potential. Please make sure none of these “death trap” stocks are lurking in your portfolio:
VZ shares were trading at $39.50 per share on Monday afternoon, up $0.17 (+0.43%). Year-to-date, VZ has gained 6.54%, versus a 1.80% rise in the benchmark S&P 500 index during the same period.
About the Author: Subhasree Kar

Subhasree’s keen interest in financial instruments led her to pursue a career as an investment analyst. After earning a Master’s degree in Economics, she gained knowledge of equity research and portfolio management at Finlatics.
The post Verizon (VZ) Earnings Alert: What to Expect and How to Position? appeared first on StockNews.com