
 Come on, this is silly:
Now the entire stock market is trading like BitCoin. It's hard to call yourself an investor when the market can swing like this in a 24-hour period, isn't it? At least in Vegas, you know why you won or lost – the little ball fell on a red number, not a black or whatever. Try, on the other hand to explain why the Nasdaq fell 7% on Wednesday and then gained 7.6% on Thursday – there's no logic to it.
That's because the market is now trading on emotions instead of reason and that's why we have our Bounce Chart and that's why our bounce chart needs to see two (2) trading days above or below a major support level before we can confirm tha status has changed. The Bounce Chart is part of our 5% Rule™ and the 5% Rule™ is not TA – it's just math. It gives us insight into the Algorythmic Trading that underlies the market and gives us a feeing for which way the programs are turning or, more accurately, what instrustions they are being fed by those emotional humans.
- Dow 36,000 to 28,800 would be a 7,200-point drop with 1,440 bounces to 30,240 (weak) and 31,680 (strong).
- S&P 4,800 is 20% above 4,000 and that makes it an 800-point drop with 160-point bounces so 4,160 (weak) and 4,320 (strong) is where we are this morning (again).
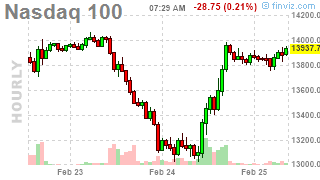
- Nasdaq is using 13,500 as the base and we bottomed yesterday at 13,580. 14,100 is the
…
