
Non-lethal weapons company Byrna (NASDAQ: BYRN) reported Q4 CY2025 results exceeding the market’s revenue expectations, with sales up 26% year on year to $35.25 million. Its GAAP profit of $0.14 per share was in line with analysts’ consensus estimates.
Is now the time to buy Byrna? Find out by accessing our full research report, it’s free.
Byrna (BYRN) Q4 CY2025 Highlights:
- Revenue: $35.25 million vs analyst estimates of $34.92 million (26% year-on-year growth, 0.9% beat)
- EPS (GAAP): $0.14 vs analyst estimates of $0.13 (in line)
- Adjusted EBITDA: $6.02 million vs analyst estimates of $6.08 million (17.1% margin, 1.1% miss)
- Operating Margin: 11.2%, down from 14.6% in the same quarter last year
- Market Capitalization: $277.7 million
Management CommentaryByrna CEO Bryan Ganz stated: “In 2025, we scaled Byrna from a largely direct-to-consumer business model, driven by conservative-leaning celebrity endorsers, into a diversified multi-platform model focused on reaching a broader audience through our nationwide dealer base. This was supported in large part by our expansion from roughly 300 chain store locations at the beginning of 2025 to approximately 900 chain store locations at the end of the year. In addition to these national and well-known chain stores, Byrna is carried at approximately 600 additional brick-and-mortar locations comprised of distributors, independent dealers, premier dealers, show dealers, and Company-owned retail stores, bringing our total footprint to more than 1,500 locations where you can touch, feel (and often shoot) a Byrna before you buy.
Company Overview
Providing civilians with tools to disable, disarm, and deter would-be assailants, Byrna (NASDAQ: BYRN) is a provider of non-lethal weapons.
Revenue Growth
Examining a company’s long-term performance can provide clues about its quality. Any business can have short-term success, but a top-tier one grows for years. Luckily, Byrna’s sales grew at an incredible 48.1% compounded annual growth rate over the last five years. Its growth beat the average industrials company and shows its offerings resonate with customers.
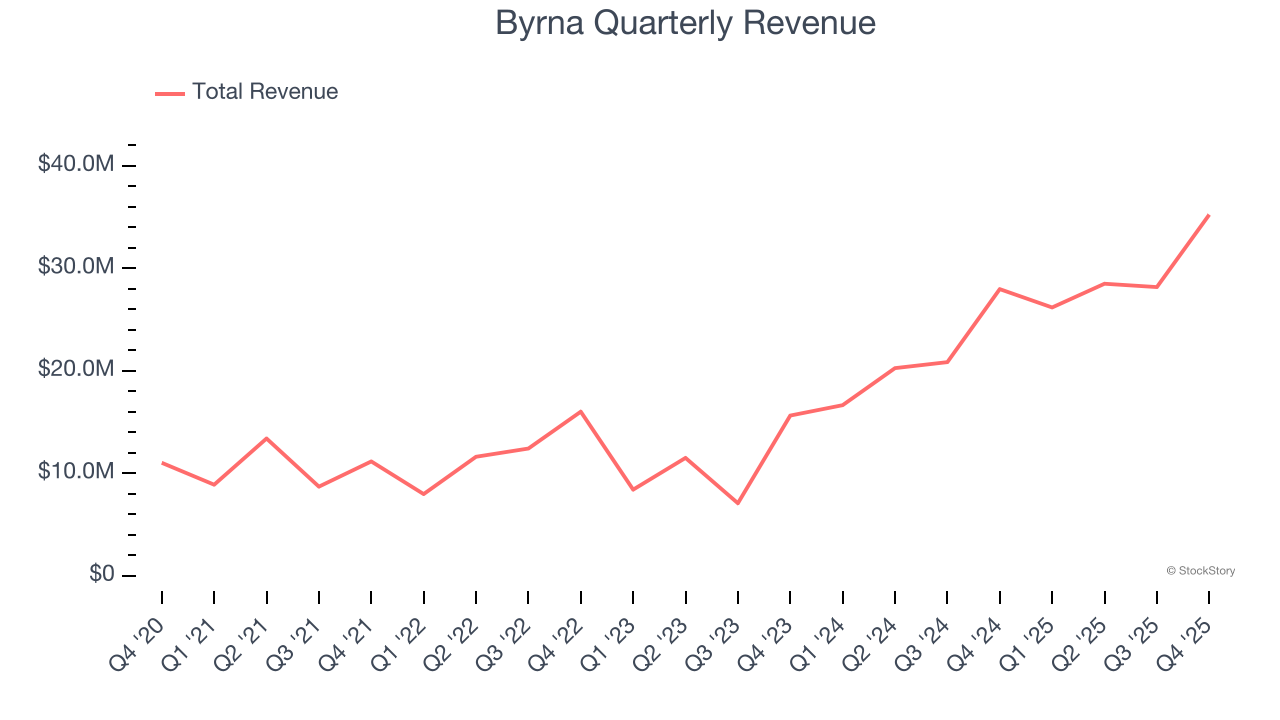
We at StockStory place the most emphasis on long-term growth, but within industrials, a half-decade historical view may miss cycles, industry trends, or a company capitalizing on catalysts such as a new contract win or a successful product line. Byrna’s annualized revenue growth of 66.4% over the last two years is above its five-year trend, suggesting its demand was strong and recently accelerated. 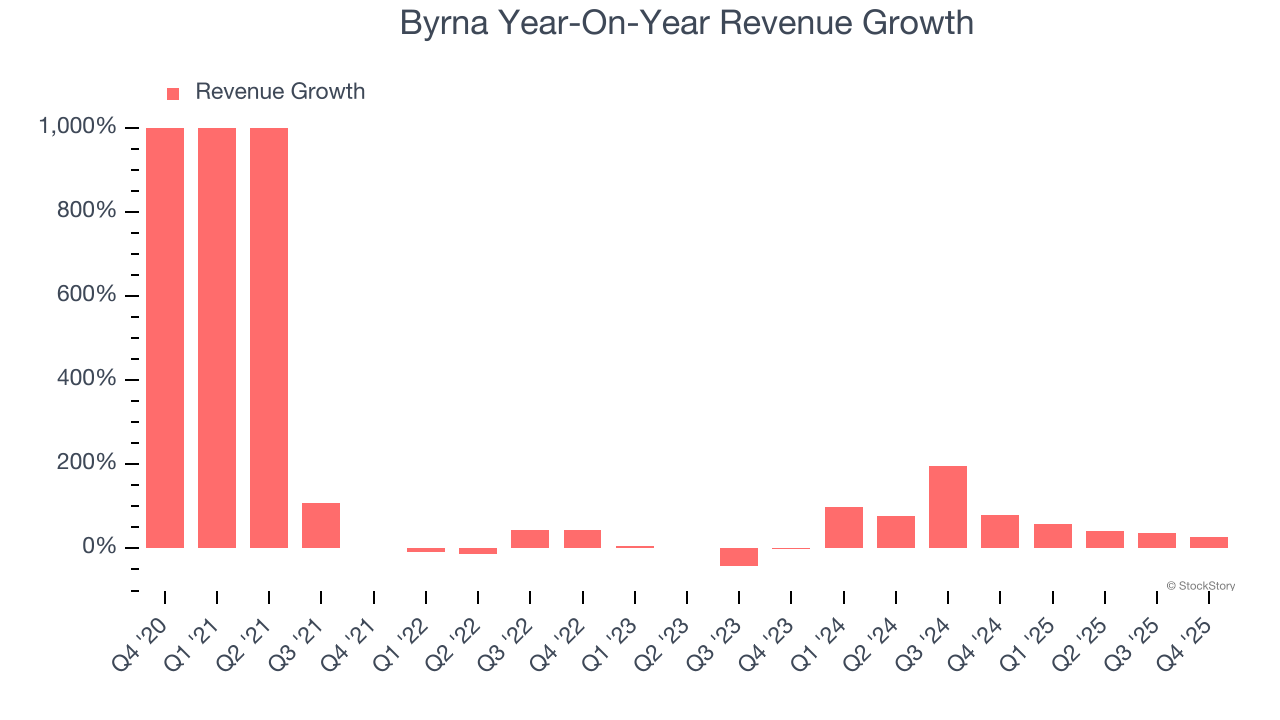
This quarter, Byrna reported robust year-on-year revenue growth of 26%, and its $35.25 million of revenue topped Wall Street estimates by 0.9%.
Looking ahead, sell-side analysts expect revenue to grow 18.8% over the next 12 months, a deceleration versus the last two years. Despite the slowdown, this projection is healthy and indicates the market is forecasting success for its products and services.
Software is eating the world and there is virtually no industry left that has been untouched by it. That drives increasing demand for tools helping software developers do their jobs, whether it be monitoring critical cloud infrastructure, integrating audio and video functionality, or ensuring smooth content streaming. Click here to access a free report on our 3 favorite stocks to play this generational megatrend.
Operating Margin
Operating margin is an important measure of profitability as it shows the portion of revenue left after accounting for all core expenses – everything from the cost of goods sold to advertising and wages. It’s also useful for comparing profitability across companies with different levels of debt and tax rates because it excludes interest and taxes.
Byrna was roughly breakeven when averaging the last five years of quarterly operating profits, one of the worst outcomes in the industrials sector.
On the plus side, Byrna’s operating margin rose by 17.8 percentage points over the last five years, as its sales growth gave it operating leverage.
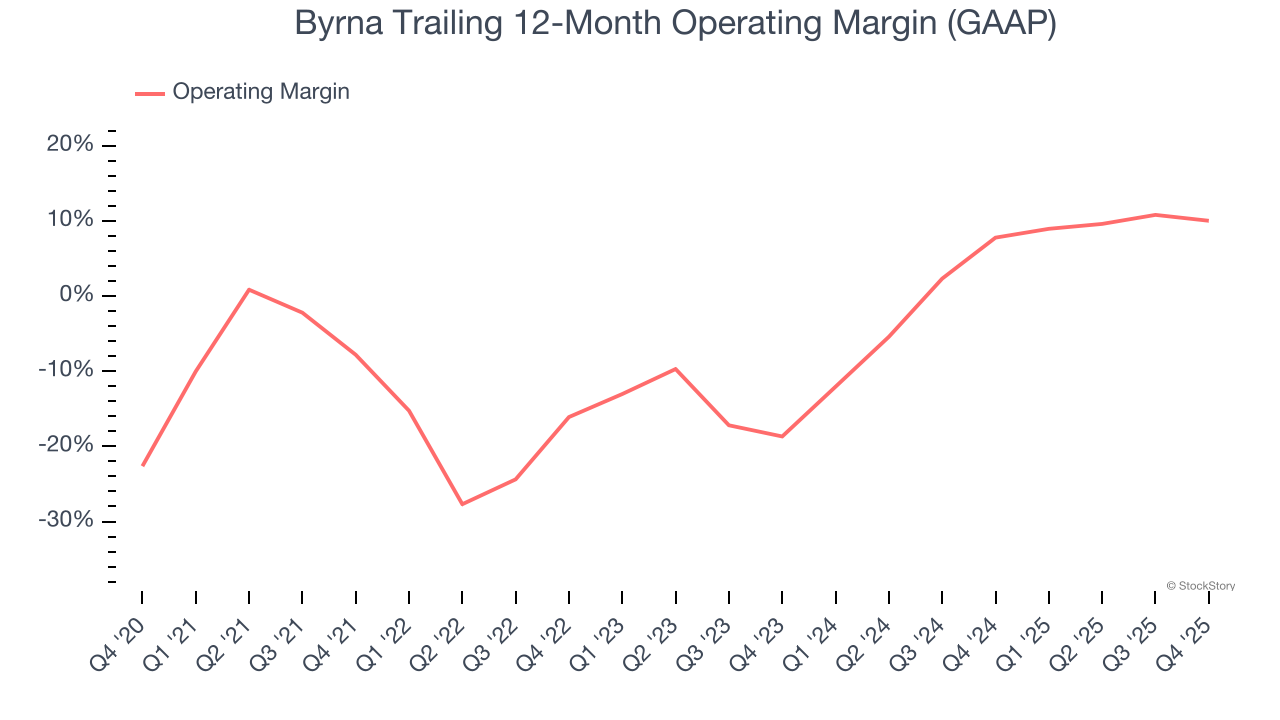
In Q4, Byrna generated an operating margin profit margin of 11.2%, down 3.4 percentage points year on year. This contraction shows it was less efficient because its expenses grew faster than its revenue.
Earnings Per Share
We track the long-term change in earnings per share (EPS) for the same reason as long-term revenue growth. Compared to revenue, however, EPS highlights whether a company’s growth is profitable.
Byrna’s full-year EPS flipped from negative to positive over the last five years. This is a good sign and shows it’s at an inflection point.
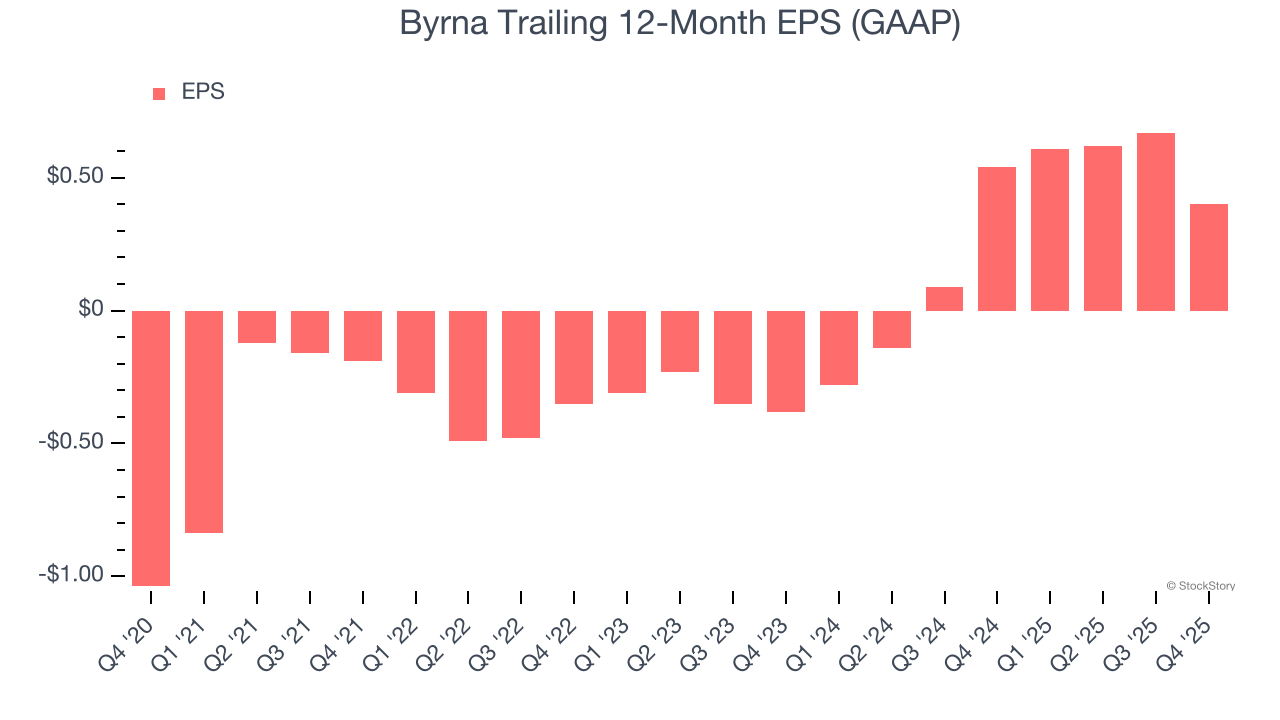
Like with revenue, we analyze EPS over a shorter period to see if we are missing a change in the business.
For Byrna, its two-year annual EPS growth of 74.7% was higher than its five-year trend. We love it when earnings growth accelerates, especially when it accelerates off an already high base.
In Q4, Byrna reported EPS of $0.14, down from $0.41 in the same quarter last year. Despite falling year on year, this print beat analysts’ estimates by 5.7%. Over the next 12 months, Wall Street expects Byrna’s full-year EPS of $0.40 to grow 52.1%.
Key Takeaways from Byrna’s Q4 Results
It was good to see Byrna narrowly top analysts’ revenue expectations this quarter. We were also glad its EPS was in line with Wall Street’s estimates. On the other hand, its EBITDA slightly missed. Zooming out, we think this was a mixed quarter. The stock traded up 5% to $12.83 immediately following the results.
Is Byrna an attractive investment opportunity right now? What happened in the latest quarter matters, but not as much as longer-term business quality and valuation, when deciding whether to invest in this stock. We cover that in our actionable full research report which you can read here (it’s free).