

Turbocharger technology company Garrett Motion (NYSE: GTX) reported revenue ahead of Wall Street’s expectations in Q4 CY2025, with sales up 5.6% year on year to $891 million. The company expects the full year’s revenue to be around $3.7 billion, close to analysts’ estimates. Its GAAP profit of $0.42 per share was 18.6% above analysts’ consensus estimates.
Is now the time to buy Garrett Motion? Find out by accessing our full research report, it’s free.
Garrett Motion (GTX) Q4 CY2025 Highlights:
- Revenue: $891 million vs analyst estimates of $875.2 million (5.6% year-on-year growth, 1.8% beat)
- EPS (GAAP): $0.42 vs analyst estimates of $0.35 (18.6% beat)
- Adjusted EBITDA: $159 million vs analyst estimates of $156.6 million (17.8% margin, 1.6% beat)
- EBITDA guidance for the upcoming financial year 2026 is $672 million at the midpoint, in line with analyst expectations
- Operating Margin: 11.6%, down from 15.3% in the same quarter last year
- Free Cash Flow Margin: 8.8%, down from 12.9% in the same quarter last year
- Market Capitalization: $4.00 billion
With a disciplined capital allocation framework and a flexible balance sheet, we enter 2026 focused on maintaining flawless execution and converting our growing pipeline into new awards. We look forward to sharing more at our 2026 Investor Day, planned for May 20, 2026, with more details to follow.” said Olivier Rabiller, President and CEO of Garrett.
Company Overview
A key player in the transition to cleaner vehicles, Garrett Motion (NYSE: GTX) designs and manufactures turbochargers, air compressors, and electric motor technologies for vehicle manufacturers and industrial applications.
Revenue Growth
A company’s long-term sales performance is one signal of its overall quality. Even a bad business can shine for one or two quarters, but a top-tier one grows for years. Unfortunately, Garrett Motion’s 3.4% annualized revenue growth over the last five years was sluggish. This was below our standard for the industrials sector and is a tough starting point for our analysis.
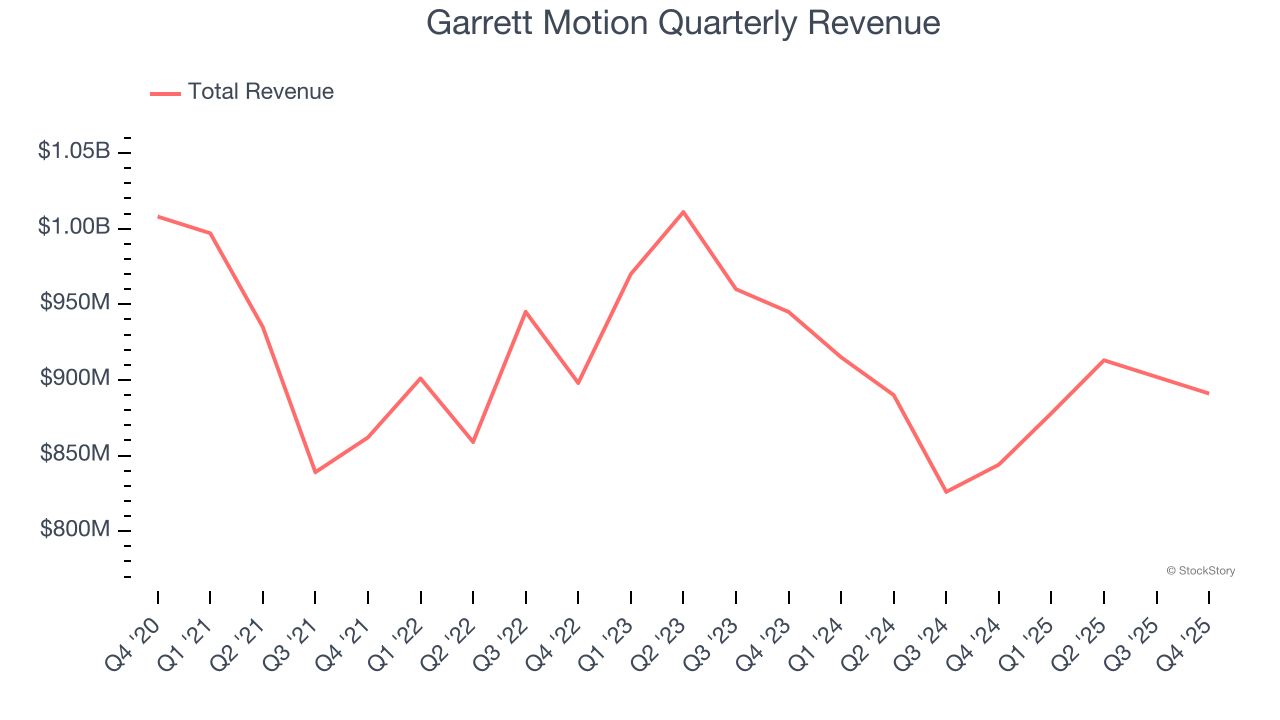
We at StockStory place the most emphasis on long-term growth, but within industrials, a half-decade historical view may miss cycles, industry trends, or a company capitalizing on catalysts such as a new contract win or a successful product line. Garrett Motion’s performance shows it grew in the past but relinquished its gains over the last two years, as its revenue fell by 4% annually. 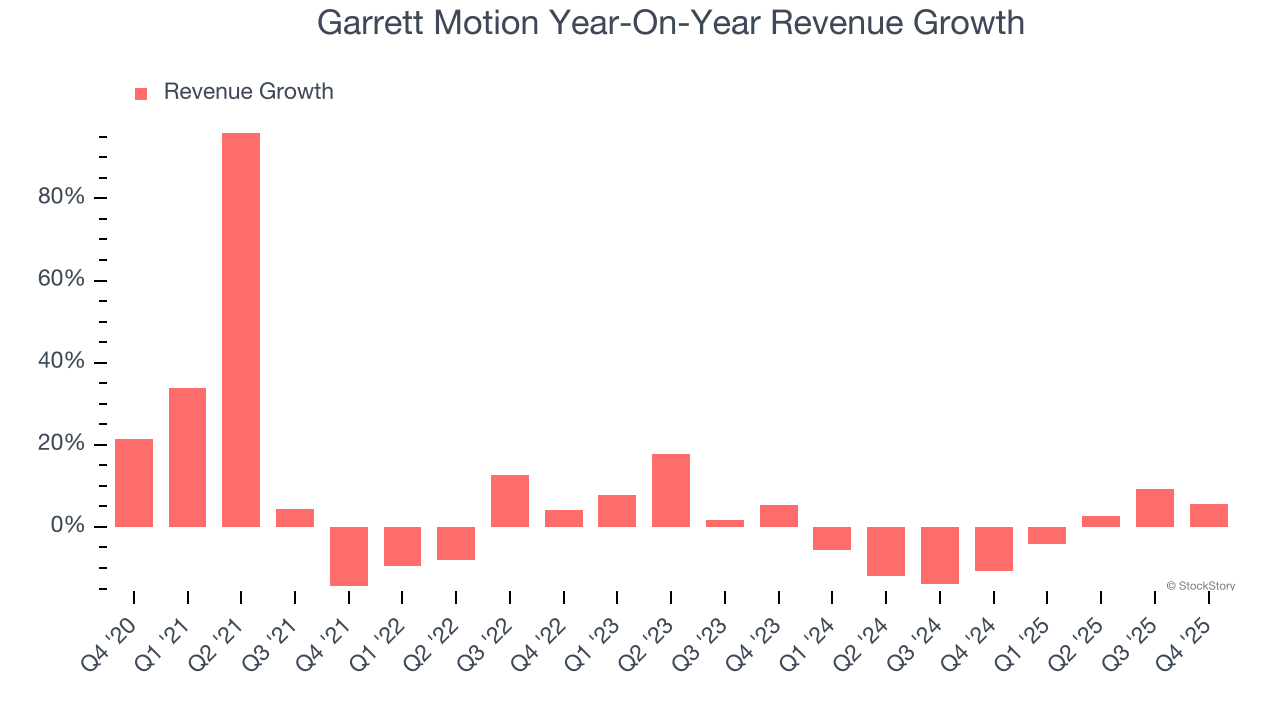
This quarter, Garrett Motion reported year-on-year revenue growth of 5.6%, and its $891 million of revenue exceeded Wall Street’s estimates by 1.8%.
Looking ahead, sell-side analysts expect revenue to grow 1.3% over the next 12 months. While this projection indicates its newer products and services will spur better top-line performance, it is still below average for the sector.
Software is eating the world and there is virtually no industry left that has been untouched by it. That drives increasing demand for tools helping software developers do their jobs, whether it be monitoring critical cloud infrastructure, integrating audio and video functionality, or ensuring smooth content streaming. Click here to access a free report on our 3 favorite stocks to play this generational megatrend.
Operating Margin
Operating margin is an important measure of profitability as it shows the portion of revenue left after accounting for all core expenses – everything from the cost of goods sold to advertising and wages. It’s also useful for comparing profitability across companies with different levels of debt and tax rates because it excludes interest and taxes.
Garrett Motion has been an efficient company over the last five years. It was one of the more profitable businesses in the industrials sector, boasting an average operating margin of 13.7%. This result was particularly impressive because of its low gross margin, which is mostly a factor of what it sells and takes huge shifts to move meaningfully. Companies have more control over their operating margins, and it’s a show of well-managed operations if they’re high when gross margins are low.
Analyzing the trend in its profitability, Garrett Motion’s operating margin decreased by 1.1 percentage points over the last five years. This raises questions about the company’s expense base because its revenue growth should have given it leverage on its fixed costs, resulting in better economies of scale and profitability.
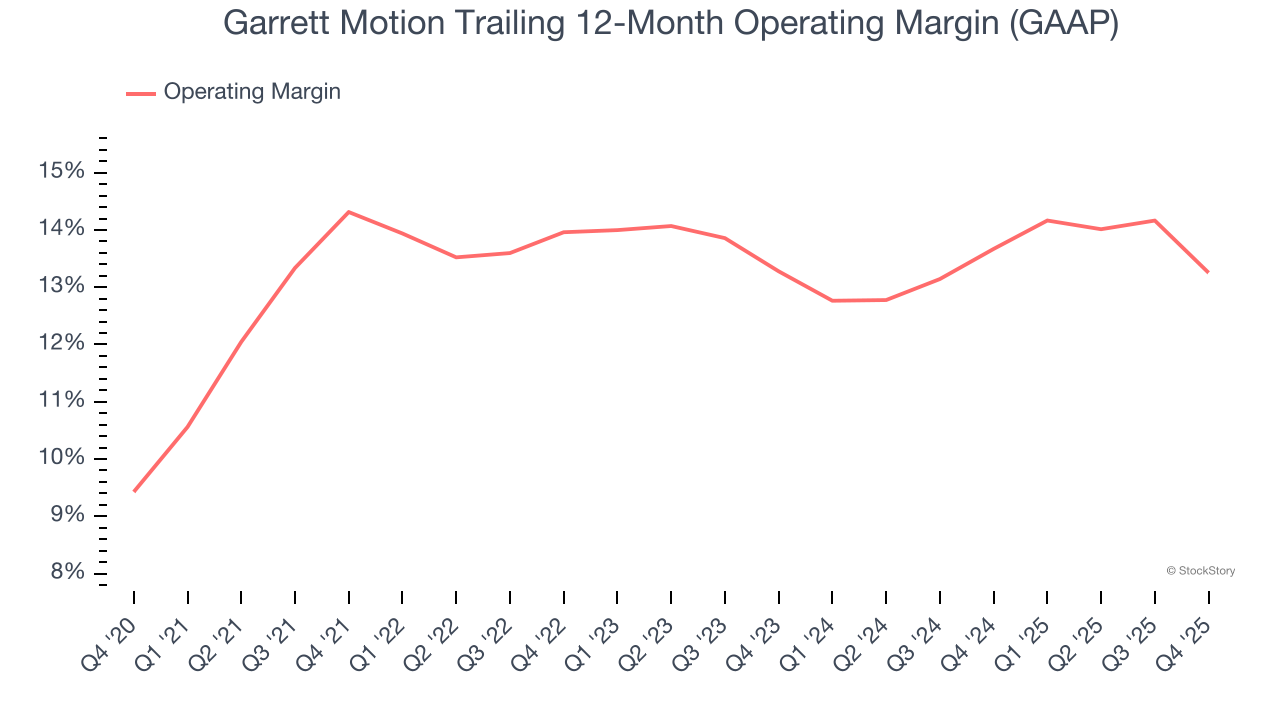
In Q4, Garrett Motion generated an operating margin profit margin of 11.6%, down 3.7 percentage points year on year. Since Garrett Motion’s operating margin decreased more than its gross margin, we can assume it was less efficient because expenses such as marketing, R&D, and administrative overhead increased.
Earnings Per Share
Revenue trends explain a company’s historical growth, but the long-term change in earnings per share (EPS) points to the profitability of that growth – for example, a company could inflate its sales through excessive spending on advertising and promotions.
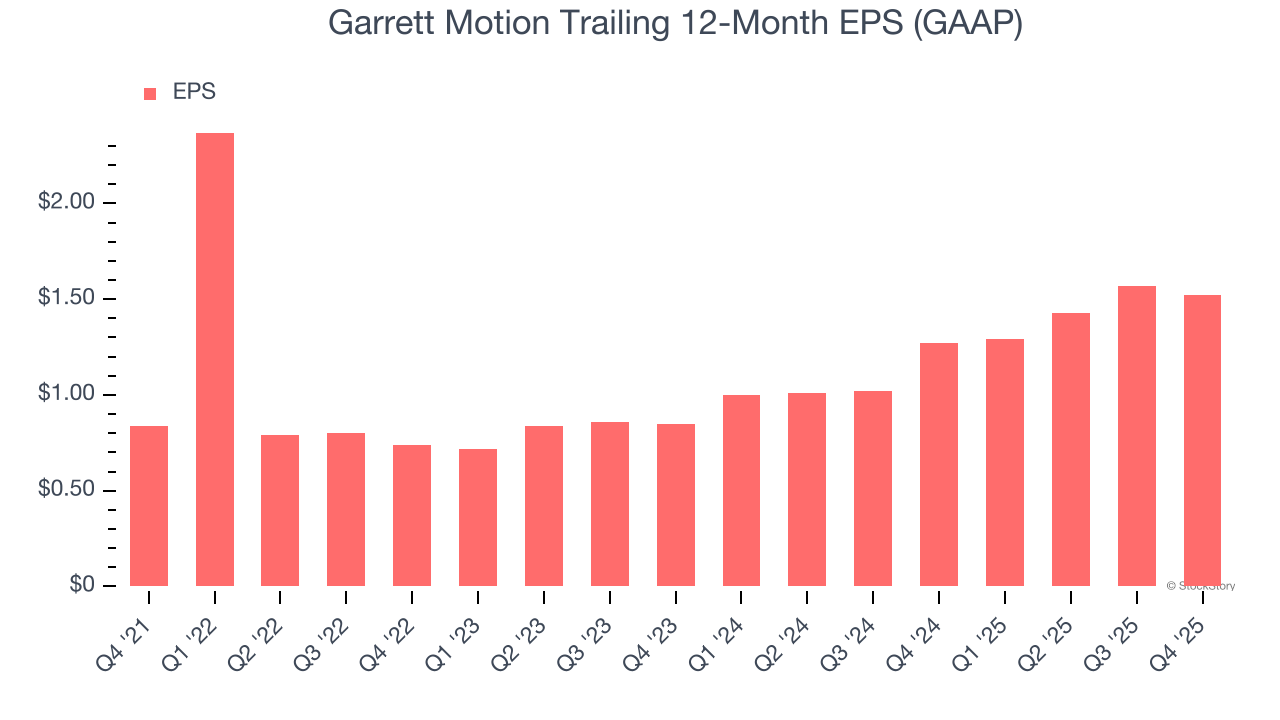
Garrett Motion’s unimpressive 5.2% annual EPS growth over the last five years aligns with its revenue performance. On the bright side, this tells us its incremental sales were profitable.
Like with revenue, we analyze EPS over a shorter period to see if we are missing a change in the business.
Garrett Motion’s two-year annual EPS growth of 33.8% was fantastic and topped its two-year revenue performance.
Diving into the nuances of Garrett Motion’s earnings can give us a better understanding of its performance. A two-year view shows that Garrett Motion has repurchased its stock, shrinking its share count by 18.5%. This tells us its EPS outperformed its revenue not because of increased operational efficiency but financial engineering, as buybacks boost per share earnings. 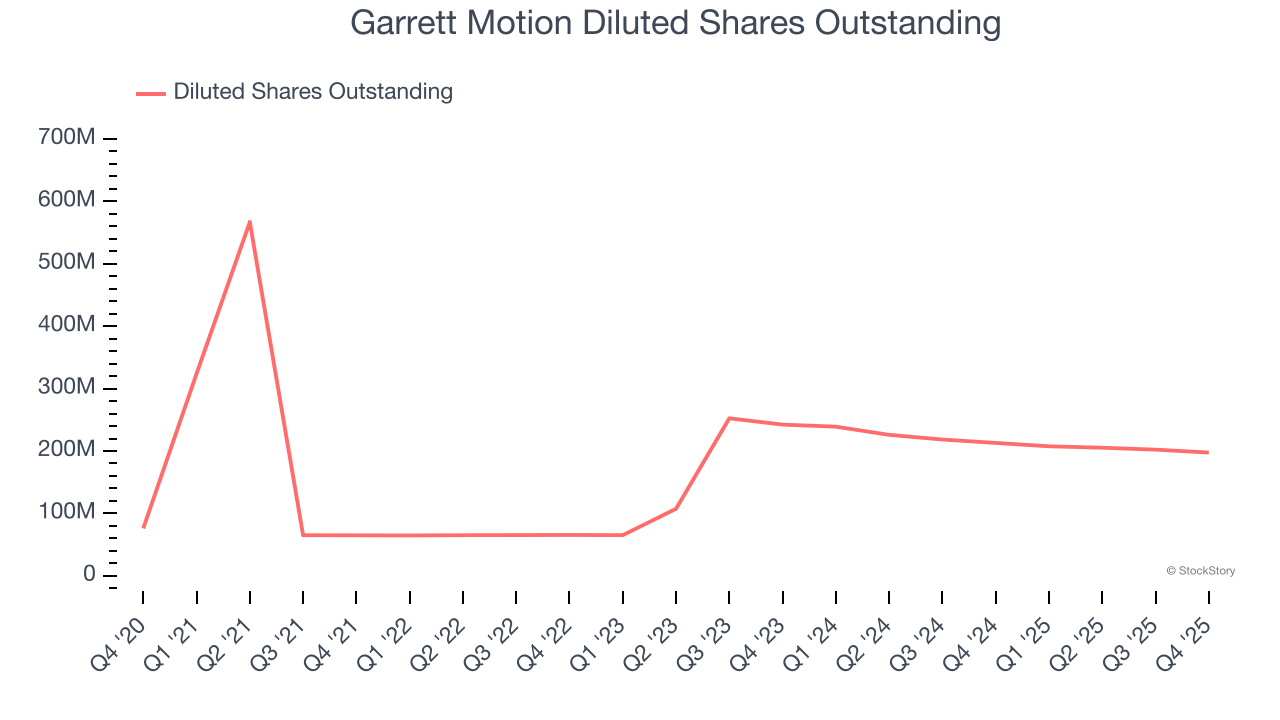
In Q4, Garrett Motion reported EPS of $0.42, down from $0.47 in the same quarter last year. Despite falling year on year, this print easily cleared analysts’ estimates. Over the next 12 months, Wall Street expects Garrett Motion’s full-year EPS of $1.52 to grow 3.2%.
Key Takeaways from Garrett Motion’s Q4 Results
It was good to see Garrett Motion beat analysts’ EPS expectations this quarter. We were also glad its revenue outperformed Wall Street’s estimates. Overall, we think this was a solid quarter with some key areas of upside. The market seemed to be hoping for more, and the stock traded down 5.3% to $19.50 immediately following the results.
So do we think Garrett Motion is an attractive buy at the current price? We think that the latest quarter is only one piece of the longer-term business quality puzzle. Quality, when combined with valuation, can help determine if the stock is a buy. We cover that in our actionable full research report which you can read here (it’s free).


