

Human capital management provider Alight (NYSE: ALIT) met Wall Street’s revenue expectations in Q4 CY2025, but sales fell by 4% year on year to $653 million. Its non-GAAP profit of $0.18 per share was 23% below analysts’ consensus estimates.
Is now the time to buy Alight? Find out by accessing our full research report, it’s free.
Alight (ALIT) Q4 CY2025 Highlights:
- Revenue: $653 million vs analyst estimates of $654.9 million (4% year-on-year decline, in line)
- Adjusted EPS: $0.18 vs analyst expectations of $0.23 (23% miss)
- Adjusted EBITDA: $178 million vs analyst estimates of $220.2 million (27.3% margin, 19.2% miss)
- Operating Margin: -115%, down from 6.5% in the same quarter last year
- Free Cash Flow Margin: 15.2%, up from 13.5% in the same quarter last year
- Market Capitalization: $684.8 million
“In 2025, Alight delivered revenue of $2.3 billion, strong cash provided by operating activities, and free cash flow,” said Rohit Verma, Alight’s Chief Executive Officer.
Company Overview
Born from a corporate spinoff in 2017 to focus on employee experience technology, Alight (NYSE: ALIT) provides human capital management solutions that help companies administer employee benefits, payroll, and workforce management systems.
Revenue Growth
A company’s long-term sales performance is one signal of its overall quality. Even a bad business can shine for one or two quarters, but a top-tier one grows for years.
With $2.26 billion in revenue over the past 12 months, Alight is a mid-sized business services company, which sometimes brings disadvantages compared to larger competitors benefiting from better economies of scale.
As you can see below, Alight’s demand was weak over the last five years. Its sales fell by 3.7% annually, a tough starting point for our analysis.
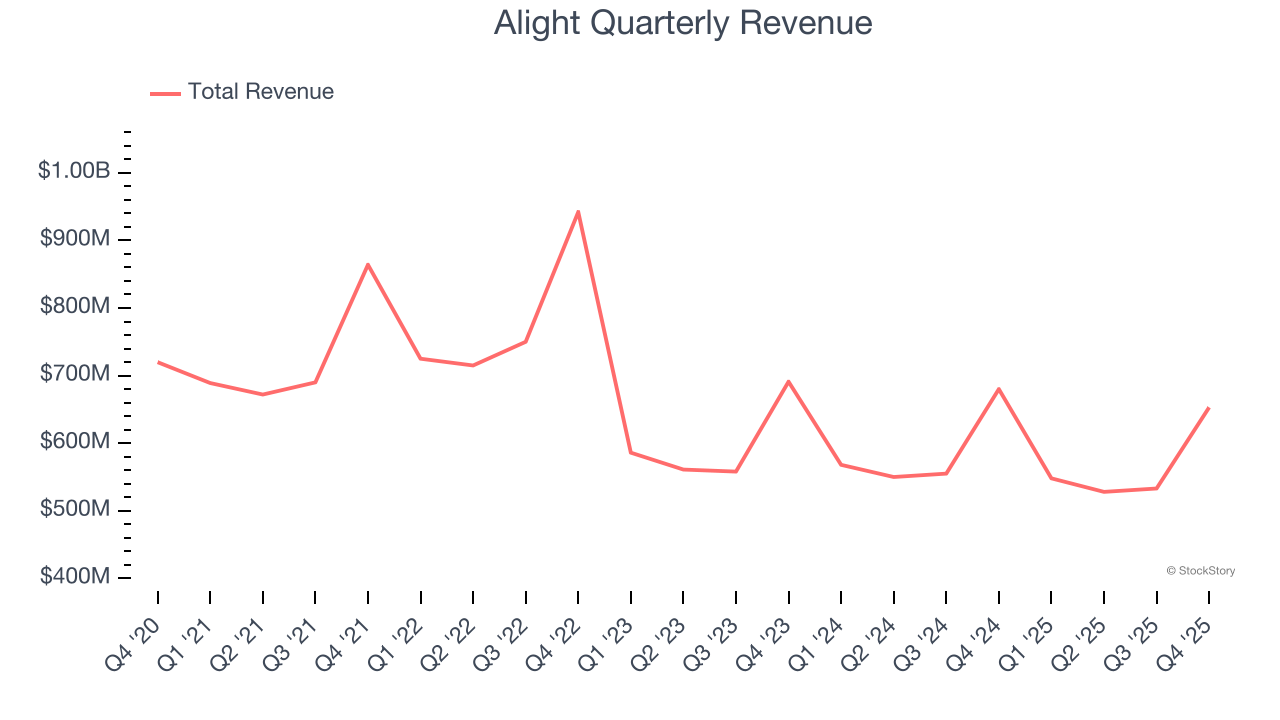
We at StockStory place the most emphasis on long-term growth, but within business services, a half-decade historical view may miss recent innovations or disruptive industry trends. Alight’s annualized revenue declines of 2.8% over the last two years align with its five-year trend, suggesting its demand has consistently shrunk. 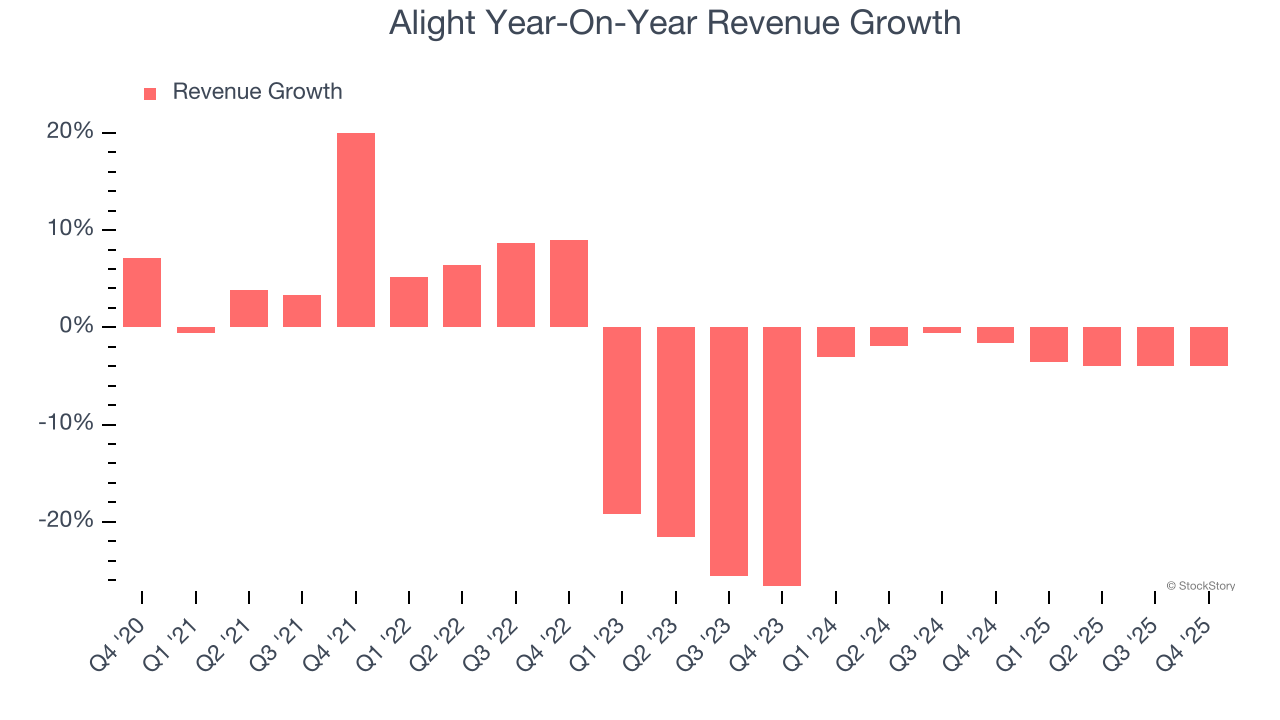
This quarter, Alight reported a rather uninspiring 4% year-on-year revenue decline to $653 million of revenue, in line with Wall Street’s estimates.
Looking ahead, sell-side analysts expect revenue to remain flat over the next 12 months. Although this projection implies its newer products and services will catalyze better top-line performance, it is still below the sector average.
Microsoft, Alphabet, Coca-Cola, Monster Beverage—all began as under-the-radar growth stories riding a massive trend. We’ve identified the next one: a profitable AI semiconductor play Wall Street is still overlooking. Go here for access to our full report.
Operating Margin
Operating margin is a key measure of profitability. Think of it as net income - the bottom line - excluding the impact of taxes and interest on debt, which are less connected to business fundamentals.
Alight’s high expenses have contributed to an average operating margin of negative 23.8% over the last five years. Unprofitable business services companies require extra attention because they could get caught swimming naked when the tide goes out. It’s hard to trust that the business can endure a full cycle.
Looking at the trend in its profitability, Alight’s operating margin decreased significantly over the last five years. Alight’s performance was poor no matter how you look at it - it shows that costs were rising and it couldn’t pass them onto its customers.
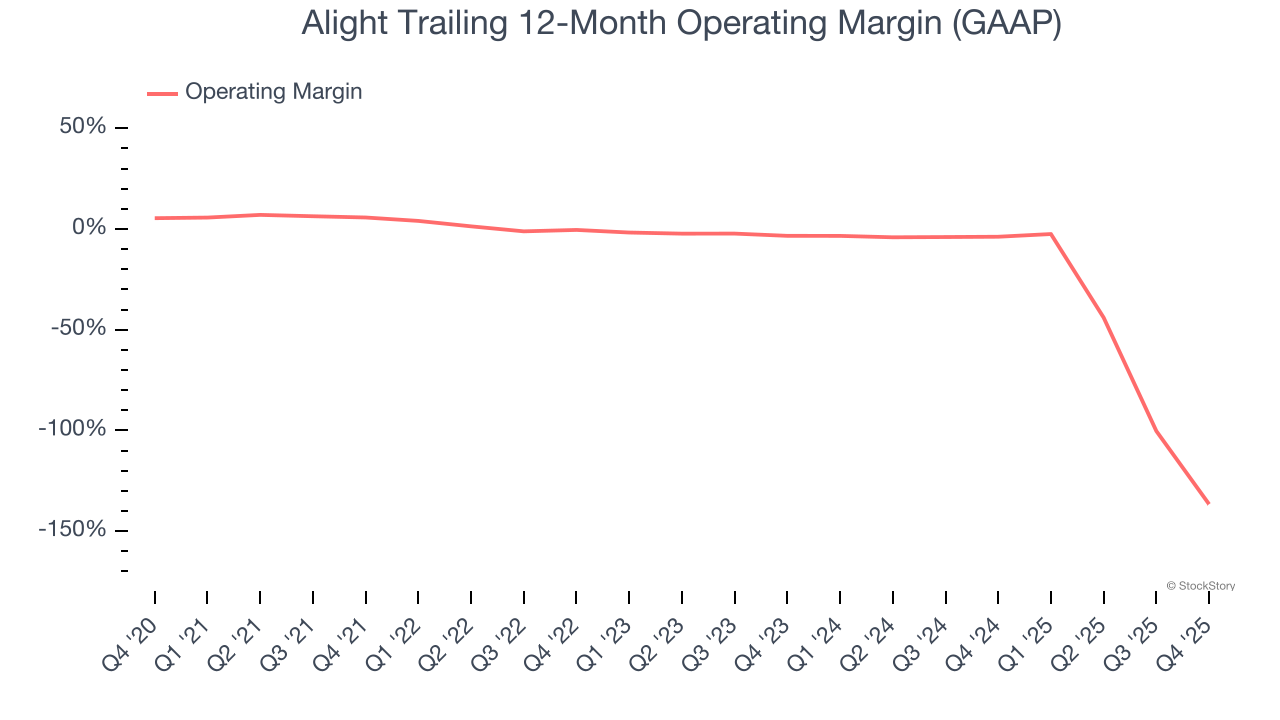
This quarter, Alight generated a negative 115% operating margin. The company's consistent lack of profits raise a flag.
Earnings Per Share
We track the long-term change in earnings per share (EPS) for the same reason as long-term revenue growth. Compared to revenue, however, EPS highlights whether a company’s growth is profitable.
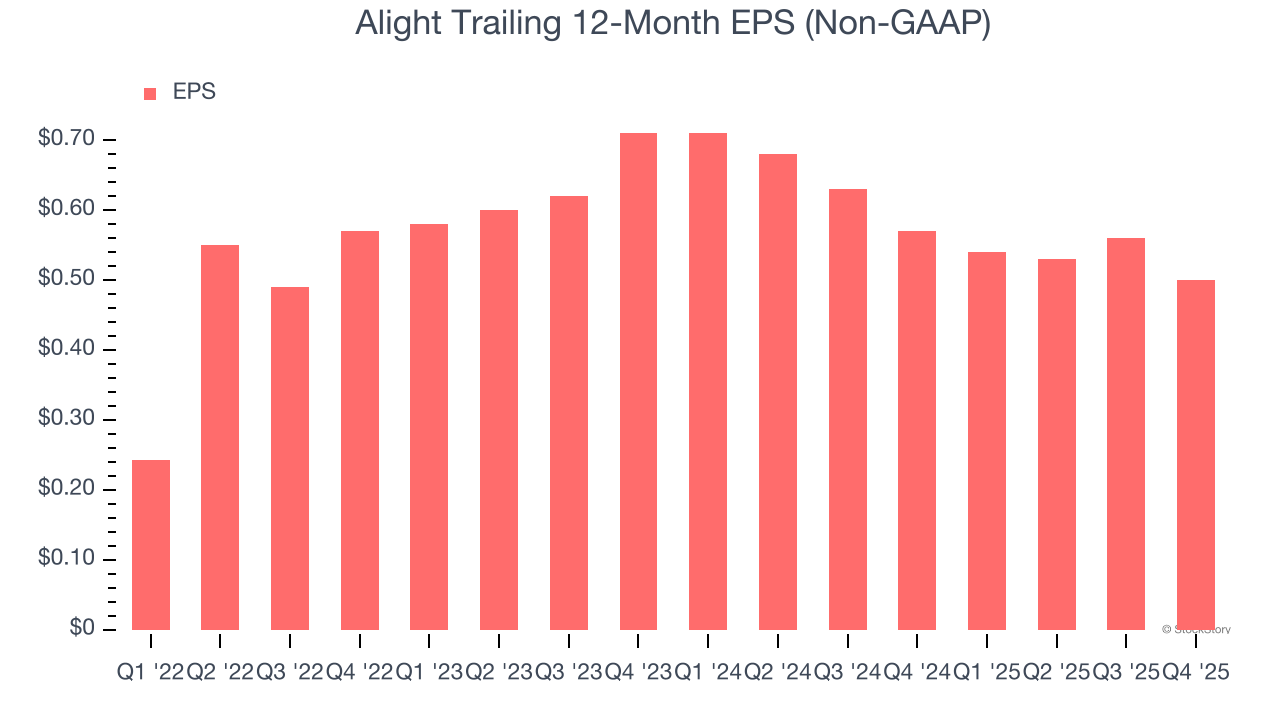
Alight’s full-year EPS grew at an astounding 34.4% compounded annual growth rate over the last four years, better than the broader business services sector.
Like with revenue, we analyze EPS over a more recent period because it can provide insight into an emerging theme or development for the business.
Sadly for Alight, its EPS declined by more than its revenue over the last two years, dropping 16.1%. This tells us the company struggled to adjust to shrinking demand.
Diving into the nuances of Alight’s earnings can give us a better understanding of its performance. Alight’s operating margin has declined over the last two yearswhile its share count has grown 5.1%. This means the company not only became less efficient with its operating expenses but also diluted its shareholders. 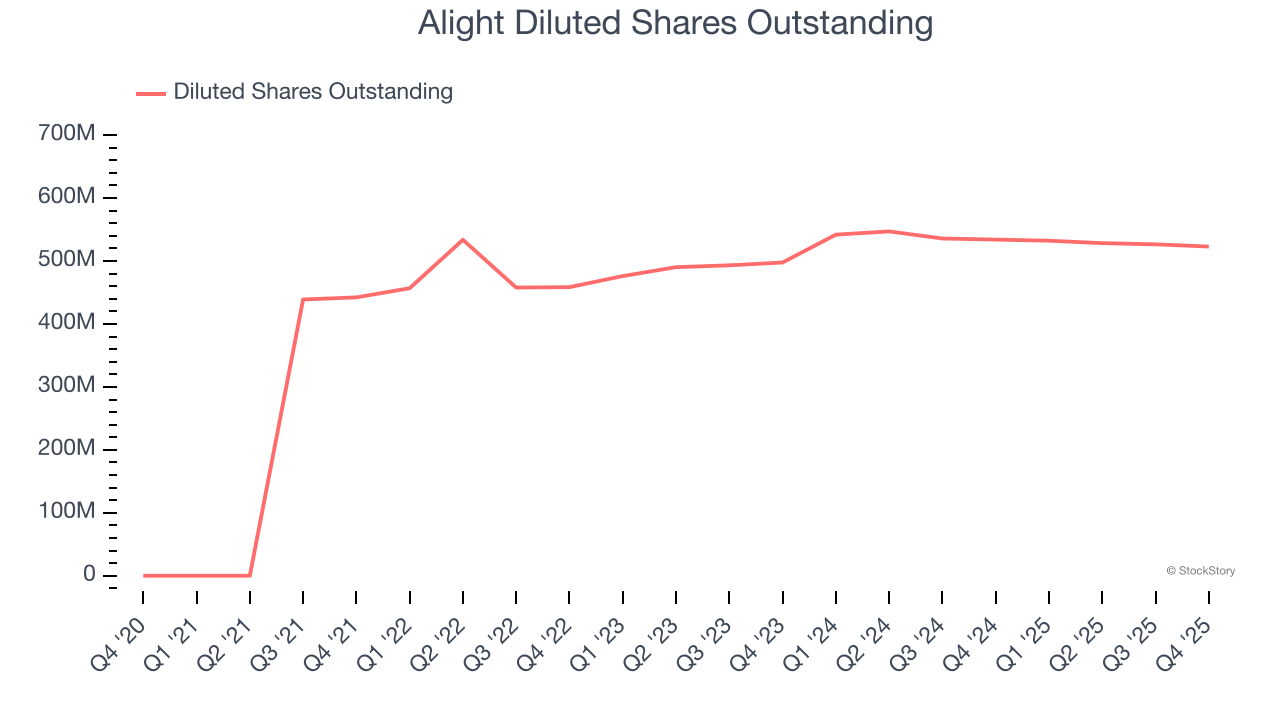
In Q4, Alight reported adjusted EPS of $0.18, down from $0.24 in the same quarter last year. This print missed analysts’ estimates, but we care more about long-term adjusted EPS growth than short-term movements. Over the next 12 months, Wall Street expects Alight’s full-year EPS of $0.50 to grow 17.7%.
Key Takeaways from Alight’s Q4 Results
We struggled to find many positives in these results. Its EPS missed and its revenue was in line with Wall Street’s estimates. Overall, this was a softer quarter. The stock remained flat at $1.31 immediately following the results.
Alight’s latest earnings report disappointed. One quarter doesn’t define a company’s quality, so let’s explore whether the stock is a buy at the current price. We think that the latest quarter is only one piece of the longer-term business quality puzzle. Quality, when combined with valuation, can help determine if the stock is a buy. We cover that in our actionable full research report which you can read here (it’s free).


