

Affordable single-family home construction company LGI Homes (NASDAQ: LGIH) fell short of the market’s revenue expectations in Q4 CY2025, with sales falling 15% year on year to $474 million. Its non-GAAP profit of $0.97 per share was 6.2% above analysts’ consensus estimates.
Is now the time to buy LGI Homes? Find out by accessing our full research report, it’s free.
LGI Homes (LGIH) Q4 CY2025 Highlights:
- Revenue: $474 million vs analyst estimates of $477.7 million (15% year-on-year decline, 0.8% miss)
- Adjusted EPS: $0.97 vs analyst estimates of $0.91 (6.2% beat)
- Operating Margin: 3.9%, down from 8.2% in the same quarter last year
- Backlog: $501.3 million at quarter end, up 112% year on year
- Market Capitalization: $1.40 billion
“Our team delivered a solid finish to the year and further strengthened the foundation that supports our long-term growth plans,” said Eric Lipar, Chairman and Chief Executive Officer of LGI Homes.
Company Overview
Based in Texas, LGI Homes (NASDAQ: LGIH) is a homebuilding company specializing in constructing affordable, entry-level single-family homes in desirable communities across the United States.
Revenue Growth
Examining a company’s long-term performance can provide clues about its quality. Any business can have short-term success, but a top-tier one grows for years. Over the last five years, LGI Homes’s demand was weak and its revenue declined by 6.4% per year. This was below our standards and is a sign of poor business quality.
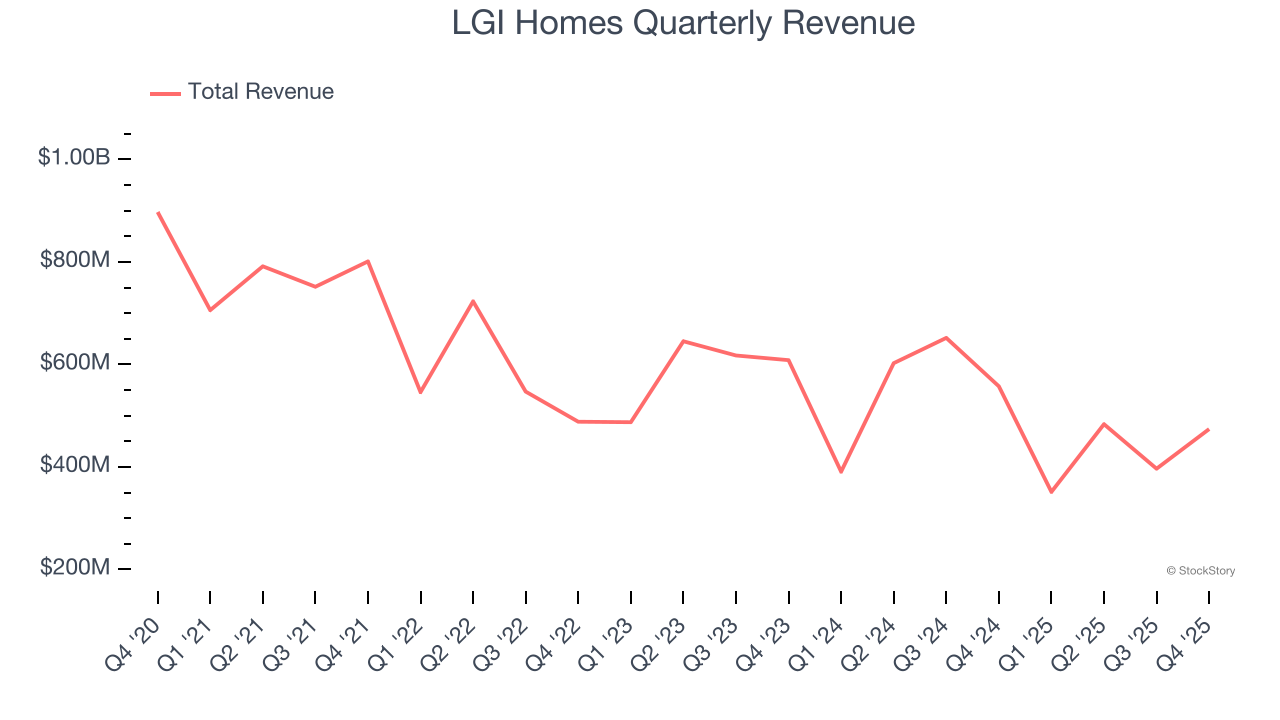
Long-term growth is the most important, but within industrials, a half-decade historical view may miss new industry trends or demand cycles. LGI Homes’s recent performance shows its demand remained suppressed as its revenue has declined by 15% annually over the last two years. 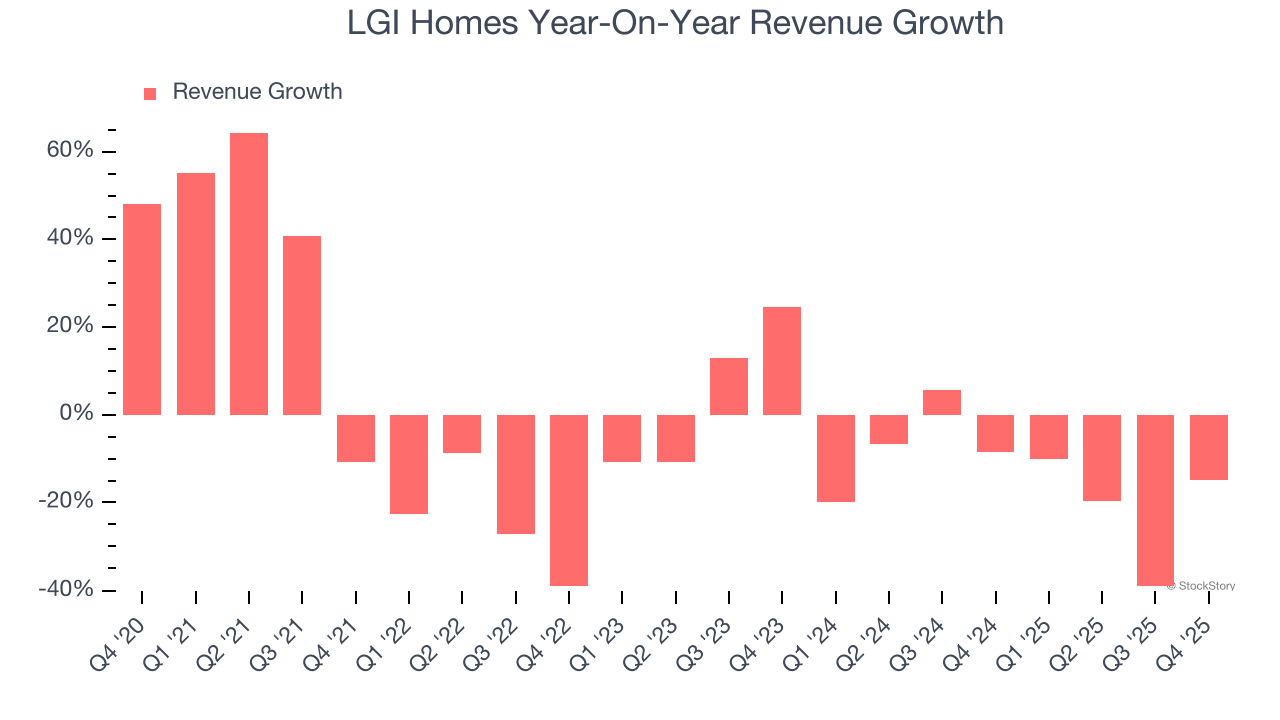
LGI Homes also reports its backlog, or the value of its outstanding orders that have not yet been executed or delivered. LGI Homes’s backlog reached $501.3 million in the latest quarter and averaged 14.6% year-on-year growth over the last two years. Because this number is better than its revenue growth, we can see the company accumulated more orders than it could fulfill and deferred revenue to the future. This could imply elevated demand for LGI Homes’s products and services but raises concerns about capacity constraints. 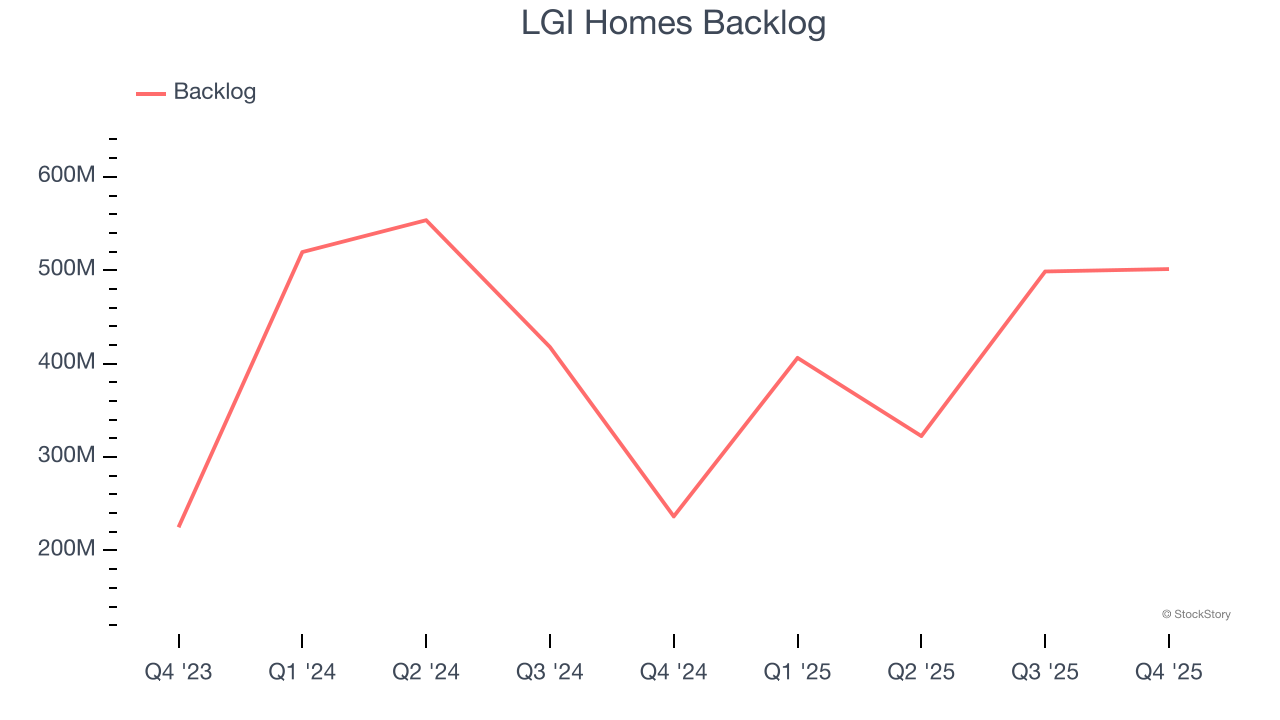
This quarter, LGI Homes missed Wall Street’s estimates and reported a rather uninspiring 15% year-on-year revenue decline, generating $474 million of revenue.
Looking ahead, sell-side analysts expect revenue to grow 4.5% over the next 12 months. While this projection suggests its newer products and services will catalyze better top-line performance, it is still below the sector average.
While Wall Street chases Nvidia at all-time highs, an under-the-radar semiconductor supplier is dominating a critical AI component these giants can’t build without. Click here to access our free report one of our favorites growth stories.
Operating Margin
LGI Homes has been an efficient company over the last five years. It was one of the more profitable businesses in the industrials sector, boasting an average operating margin of 12.6%. This result was particularly impressive because of its low gross margin, which is mostly a factor of what it sells and takes huge shifts to move meaningfully. Companies have more control over their operating margins, and it’s a show of well-managed operations if they’re high when gross margins are low.
Analyzing the trend in its profitability, LGI Homes’s operating margin decreased by 13.3 percentage points over the last five years. Even though its historical margin was healthy, shareholders will want to see LGI Homes become more profitable in the future.
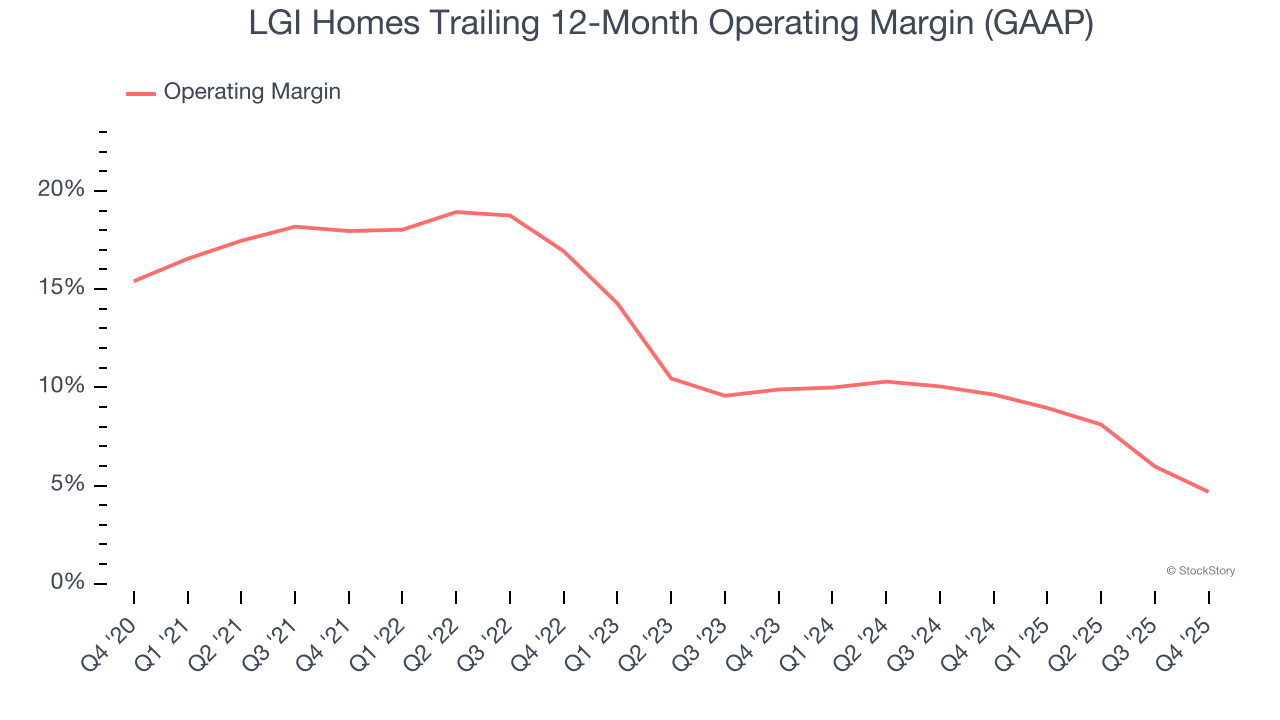
This quarter, LGI Homes generated an operating margin profit margin of 3.9%, down 4.3 percentage points year on year. Since LGI Homes’s gross margin decreased more than its operating margin, we can assume its recent inefficiencies were driven more by weaker leverage on its cost of sales rather than increased marketing, R&D, and administrative overhead expenses.
Earnings Per Share
Revenue trends explain a company’s historical growth, but the long-term change in earnings per share (EPS) points to the profitability of that growth – for example, a company could inflate its sales through excessive spending on advertising and promotions.
Sadly for LGI Homes, its EPS declined by 21.9% annually over the last five years, more than its revenue. This tells us the company struggled because its fixed cost base made it difficult to adjust to shrinking demand.
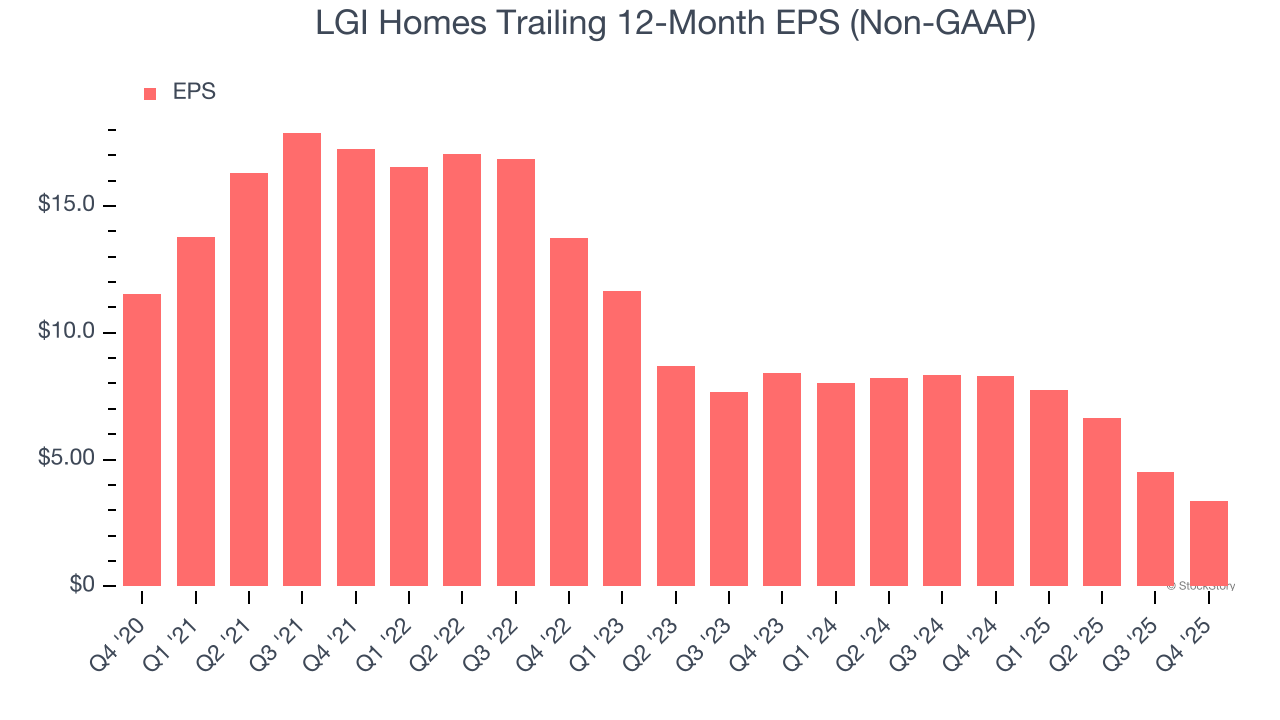
Diving into the nuances of LGI Homes’s earnings can give us a better understanding of its performance. As we mentioned earlier, LGI Homes’s operating margin declined by 13.3 percentage points over the last five years. This was the most relevant factor (aside from the revenue impact) behind its lower earnings; interest expenses and taxes can also affect EPS but don’t tell us as much about a company’s fundamentals.
Like with revenue, we analyze EPS over a shorter period to see if we are missing a change in the business.
For LGI Homes, its two-year annual EPS declines of 36.9% show it’s continued to underperform. These results were bad no matter how you slice the data.
In Q4, LGI Homes reported adjusted EPS of $0.97, down from $2.15 in the same quarter last year. Despite falling year on year, this print beat analysts’ estimates by 6.2%. Over the next 12 months, Wall Street expects LGI Homes’s full-year EPS of $3.35 to grow 29%.
Key Takeaways from LGI Homes’s Q4 Results
It was good to see LGI Homes beat analysts’ EPS expectations this quarter. On the other hand, its revenue slightly missed. Overall, this was a weaker quarter. The stock traded down 3.1% to $58.95 immediately following the results.
So should you invest in LGI Homes right now? When making that decision, it’s important to consider its valuation, business qualities, as well as what has happened in the latest quarter. We cover that in our actionable full research report which you can read here (it’s free).


