Since August 2025, Chart has been in a holding pattern, posting a small return of 4.2% while floating around $207.01.
Given the underwhelming price action, is now a good time to buy GTLS? Or should investors expect a bumpy road ahead? Find out in our full research report, it’s free.
Why Is Chart a Good Business?
Installing the first bulk Co2 tank for McDonalds’s sodas, Chart (NYSE: GTLS) provides equipment to store and transport gasses.
1. Surging Backlog Locks In Future Sales
We can better understand Gas and Liquid Handling companies by analyzing their backlog. This metric shows the value of outstanding orders that have not yet been executed or delivered, giving visibility into Chart’s future revenue streams.
Chart’s backlog punched in at $6.05 billion in the latest quarter, and over the last two years, its year-on-year growth averaged 25.6%. This performance was fantastic and shows the company has a robust sales pipeline because it is accumulating more orders than it can fulfill. Its growth also suggests that customers are committing to Chart for the long term, enhancing the business’s predictability. 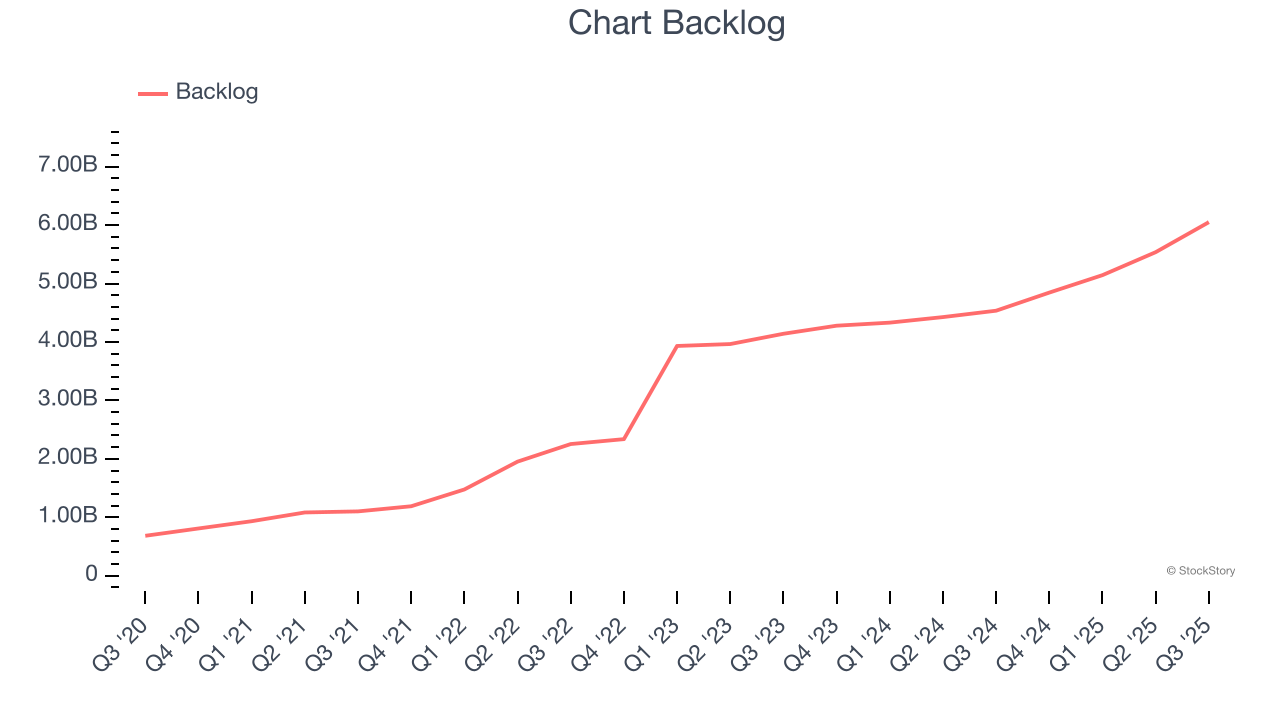
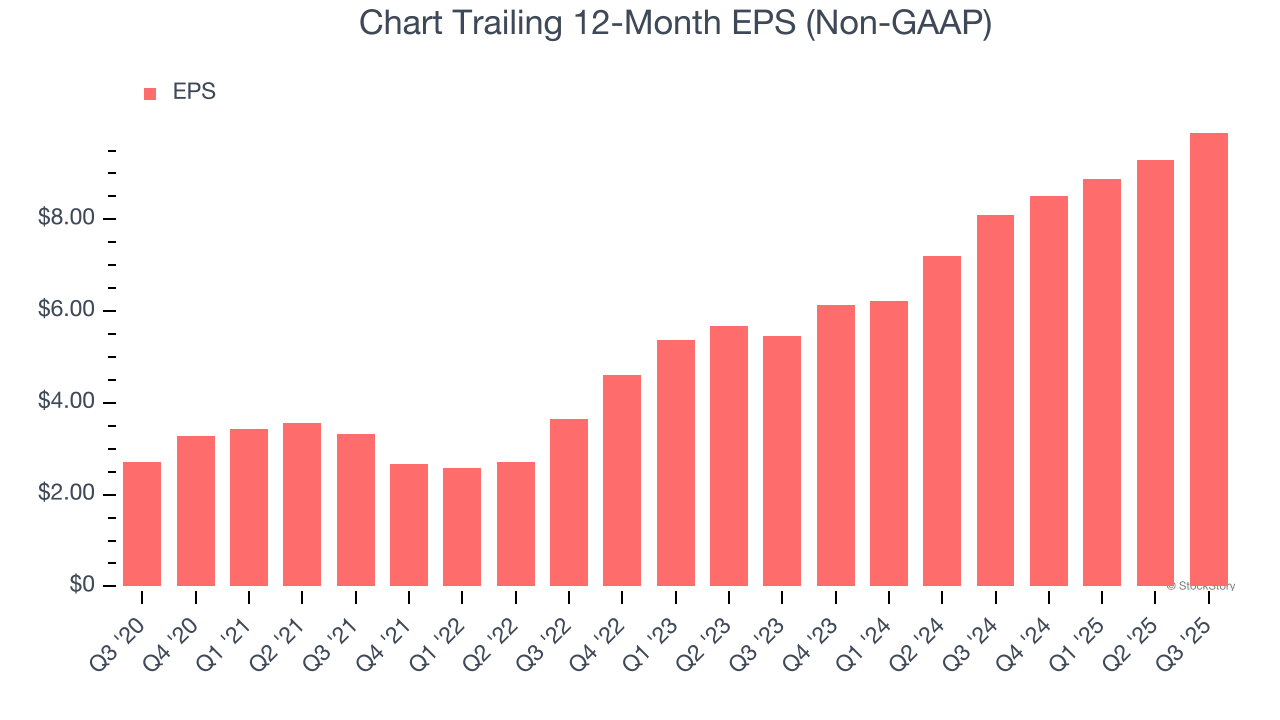
2. Outstanding Long-Term EPS Growth
Analyzing the long-term change in earnings per share (EPS) shows whether a company's incremental sales were profitable – for example, revenue could be inflated through excessive spending on advertising and promotions.
Chart’s astounding 29.5% annual EPS growth over the last five years aligns with its revenue performance. This tells us its incremental sales were profitable.
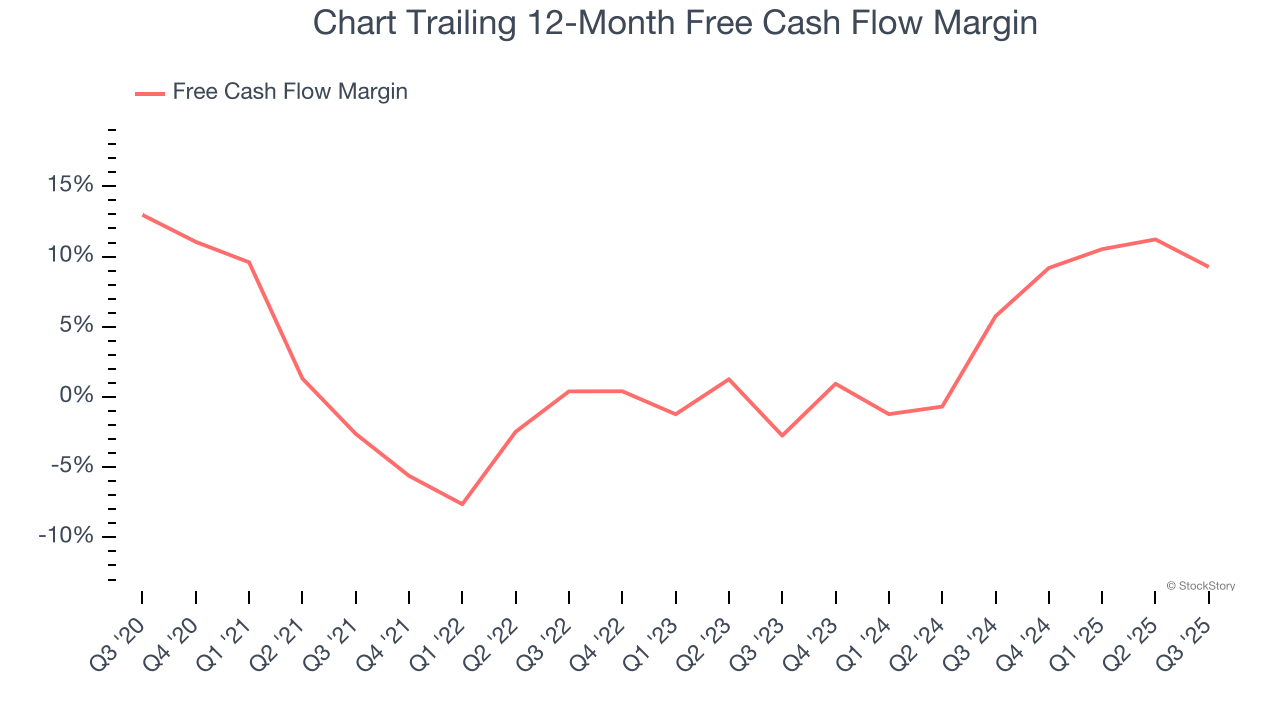
3. Increasing Free Cash Flow Margin Juices Financials
Free cash flow isn't a prominently featured metric in company financials and earnings releases, but we think it's telling because it accounts for all operating and capital expenses, making it tough to manipulate. Cash is king.
As you can see below, Chart’s margin expanded by 11.9 percentage points over the last five years. The company’s improvement shows it’s heading in the right direction, and we can see it became a less capital-intensive business because its free cash flow profitability rose more than its operating profitability. Chart’s free cash flow margin for the trailing 12 months was 9.3%.
Final Judgment
These are just a few reasons why Chart is one of the best industrials companies out there, but at $207.01 per share (or 16.8× forward P/E), is now the time to initiate a position? See for yourself in our in-depth research report, it’s free.
High-Quality Stocks for All Market Conditions
Your portfolio can’t afford to be based on yesterday’s story. The risk in a handful of heavily crowded stocks is rising daily.
The names generating the next wave of massive growth are right here in our Top 5 Strong Momentum Stocks for this week. This is a curated list of our High Quality stocks that have generated a market-beating return of 244% over the last five years (as of June 30, 2025).
Stocks that have made our list include now familiar names such as Nvidia (+1,326% between June 2020 and June 2025) as well as under-the-radar businesses like the once-micro-cap company Tecnoglass (+1,754% five-year return). Find your next big winner with StockStory today.