
TFS Financial has followed the market’s trajectory closely, rising in tandem with the S&P 500 over the past six months. The stock has climbed by 11.1% to $14.47 per share while the index has gained 10%.
Is there a buying opportunity in TFS Financial, or does it present a risk to your portfolio? Get the full stock story straight from our expert analysts, it’s free.
Why Do We Think TFS Financial Will Underperform?
We're swiping left on TFS Financial for now. Here are three reasons you should be careful with TFSL and a stock we'd rather own.
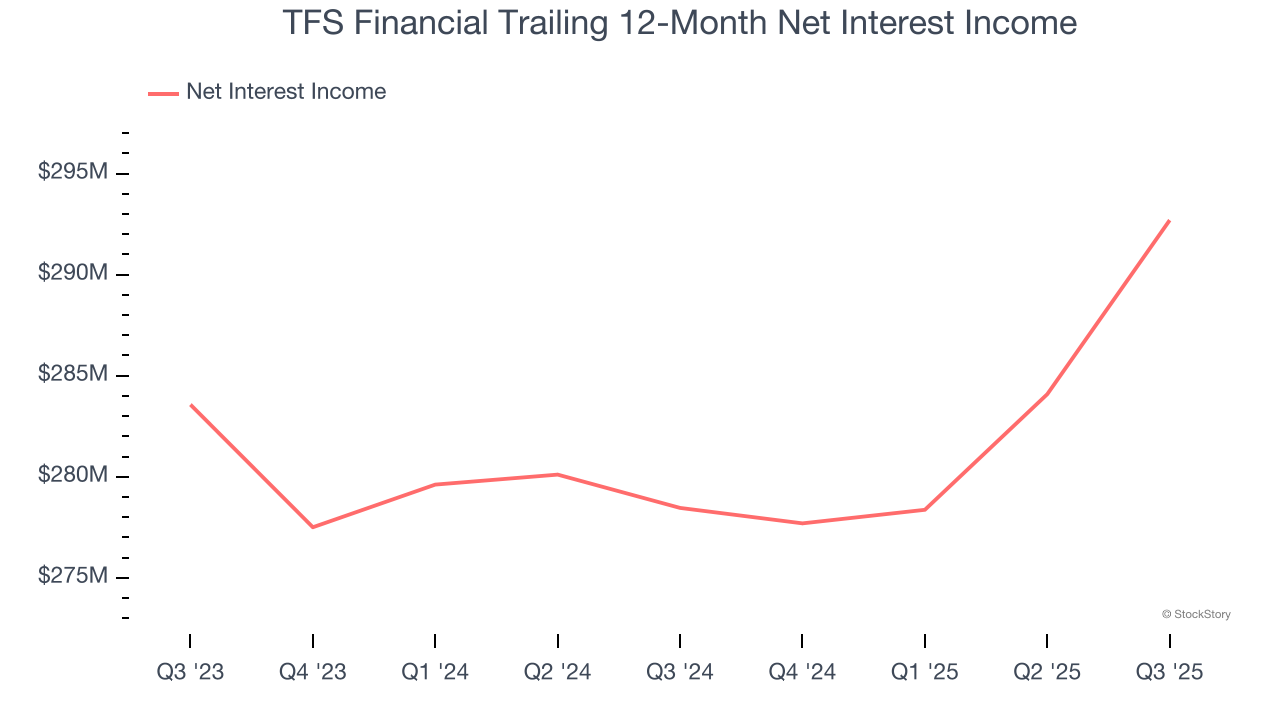
1. Net Interest Income Points to Soft Demand
Our experience and research show the market cares primarily about a bank’s net interest income growth as one-time fees are considered a lower-quality and non-recurring revenue source.
TFS Financial’s net interest income has grown at a 3.9% annualized rate over the last five years, much worse than the broader banking industry. Its growth was driven by an increase in its outstanding loans as its net interest margin, which represents how much a bank earns in relation to its outstanding loan book, was flat throughout that period.
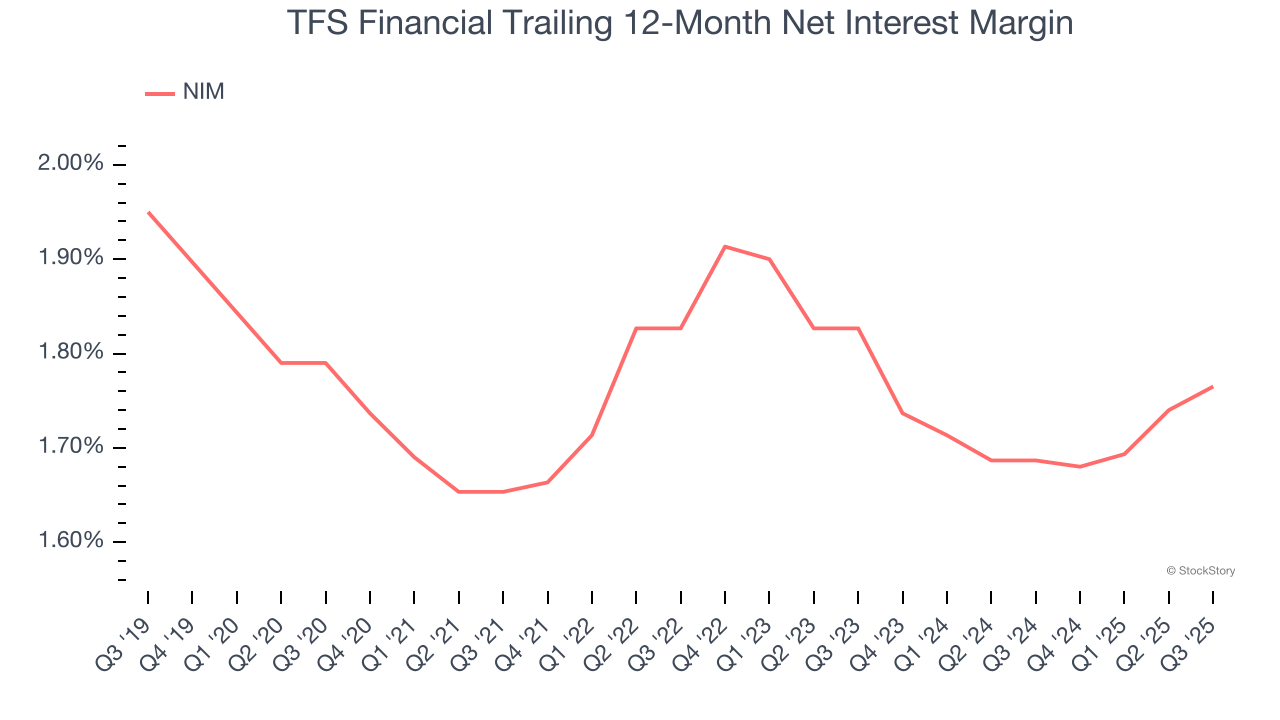
2. Low Net Interest Margin Reveals Weak Loan Book Profitability
Net interest margin (NIM) serves as a critical gauge of a bank's fundamental profitability by showing the spread between interest income and interest expenses. It's essential for understanding whether a firm can sustainably generate returns from its lending operations.
Over the past two years, we can see that TFS Financial’s net interest margin averaged a poor 1.7%. This metric is well below other banks, signaling its loans aren’t very profitable.
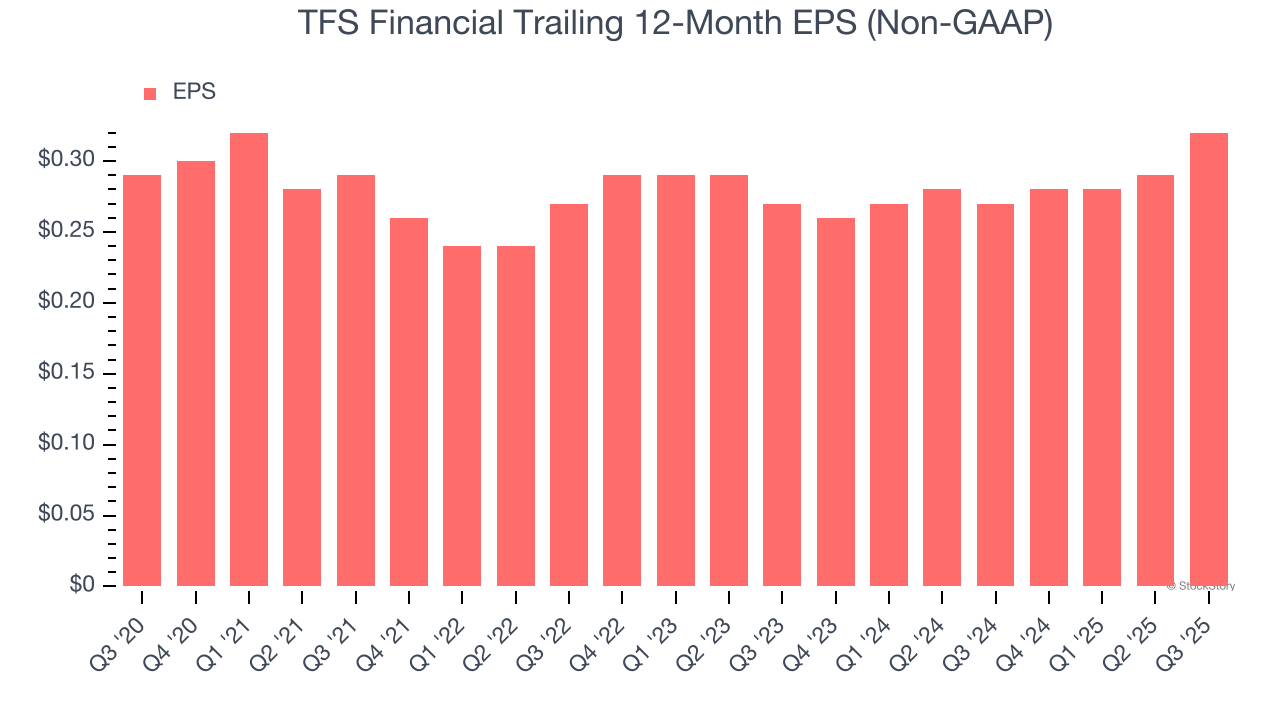
3. EPS Barely Growing
We track the long-term change in earnings per share (EPS) because it highlights whether a company’s growth is profitable.
TFS Financial’s weak 2% annual EPS growth over the last five years aligns with its revenue performance. This tells us it maintained its per-share profitability as it expanded.
Final Judgment
TFS Financial doesn’t pass our quality test. That said, the stock currently trades at 2.1× forward P/B (or $14.47 per share). This multiple tells us a lot of good news is priced in - you can find more timely opportunities elsewhere. Let us point you toward a safe-and-steady industrials business benefiting from an upgrade cycle.
Stocks We Would Buy Instead of TFS Financial
Your portfolio can’t afford to be based on yesterday’s story. The risk in a handful of heavily crowded stocks is rising daily.
The names generating the next wave of massive growth are right here in our Top 5 Strong Momentum Stocks for this week. This is a curated list of our High Quality stocks that have generated a market-beating return of 244% over the last five years (as of June 30, 2025).
Stocks that have made our list include now familiar names such as Nvidia (+1,326% between June 2020 and June 2025) as well as under-the-radar businesses like the once-micro-cap company Kadant (+351% five-year return). Find your next big winner with StockStory today.