
Credit reporting company TransUnion (NYSE: TRU) reported revenue ahead of Wall Street’s expectations in Q1 CY2025, with sales up 7.3% year on year to $1.10 billion. On the other hand, next quarter’s revenue guidance of $1.09 billion was less impressive, coming in 0.8% below analysts’ estimates. Its non-GAAP profit of $1.05 per share was 7.3% above analysts’ consensus estimates.
Is now the time to buy TransUnion? Find out by accessing our full research report, it’s free.
TransUnion (TRU) Q1 CY2025 Highlights:
- Revenue: $1.10 billion vs analyst estimates of $1.07 billion (7.3% year-on-year growth, 2.3% beat)
- Adjusted EPS: $1.05 vs analyst estimates of $0.98 (7.3% beat)
- Adjusted EBITDA: $397.1 million vs analyst estimates of $381.7 million (36.2% margin, 4% beat)
- The company slightly lifted its revenue guidance for the full year to $4.39 billion at the midpoint from $4.36 billion
- Management reiterated its full-year Adjusted EPS guidance of $4.01 at the midpoint
- EBITDA guidance for the full year is $1.57 billion at the midpoint, in line with analyst expectations
- Operating Margin: 23.2%, up from 15.4% in the same quarter last year
- Free Cash Flow was -$15.9 million compared to -$8.4 million in the same quarter last year
- Market Capitalization: $15.08 billion
“In the first quarter, TransUnion delivered strong results that again exceeded financial guidance,” said Chris Cartwright, President and CEO.
Company Overview
One of the three major credit bureaus in the United States alongside Equifax and Experian, TransUnion (NYSE: TRU) is a global information and insights company that provides credit reports, fraud prevention tools, and data analytics to help businesses make decisions and consumers manage their financial health.
Data & Business Process Services
A combination of increasing reliance on data and analytics across various industries and the desire for cost efficiency through outsourcing could mean that companies in this space gain. As functions such as payroll, HR, and credit risk assessment rely on more digitization, key players in the data & business process services industry could be increased demand. On the other hand, the sector faces headwinds from growing regulatory scrutiny on data privacy and security, with laws like GDPR and evolving U.S. regulations potentially limiting data collection and monetization strategies. Additionally, rising cyber threats pose risks to firms handling sensitive personal and financial information, creating outsized headline risk when things go wrong in this area.
Sales Growth
A company’s long-term performance is an indicator of its overall quality. Even a bad business can shine for one or two quarters, but a top-tier one grows for years.
With $4.26 billion in revenue over the past 12 months, TransUnion is a mid-sized business services company, which sometimes brings disadvantages compared to larger competitors benefiting from better economies of scale. On the bright side, it can still flex high growth rates because it’s working from a smaller revenue base.
As you can see below, TransUnion grew its sales at an impressive 9.3% compounded annual growth rate over the last five years. This shows it had high demand, a useful starting point for our analysis.
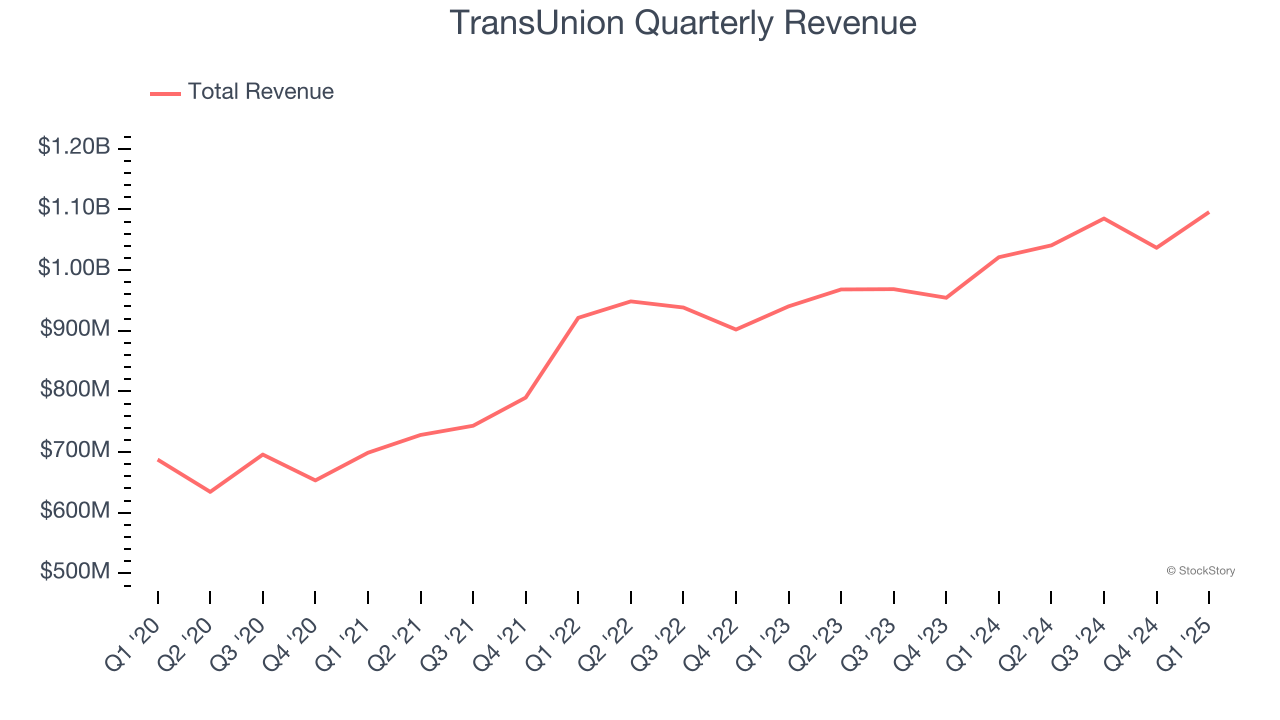
Long-term growth is the most important, but within business services, a half-decade historical view may miss new innovations or demand cycles. TransUnion’s annualized revenue growth of 6.9% over the last two years is below its five-year trend, but we still think the results were respectable. 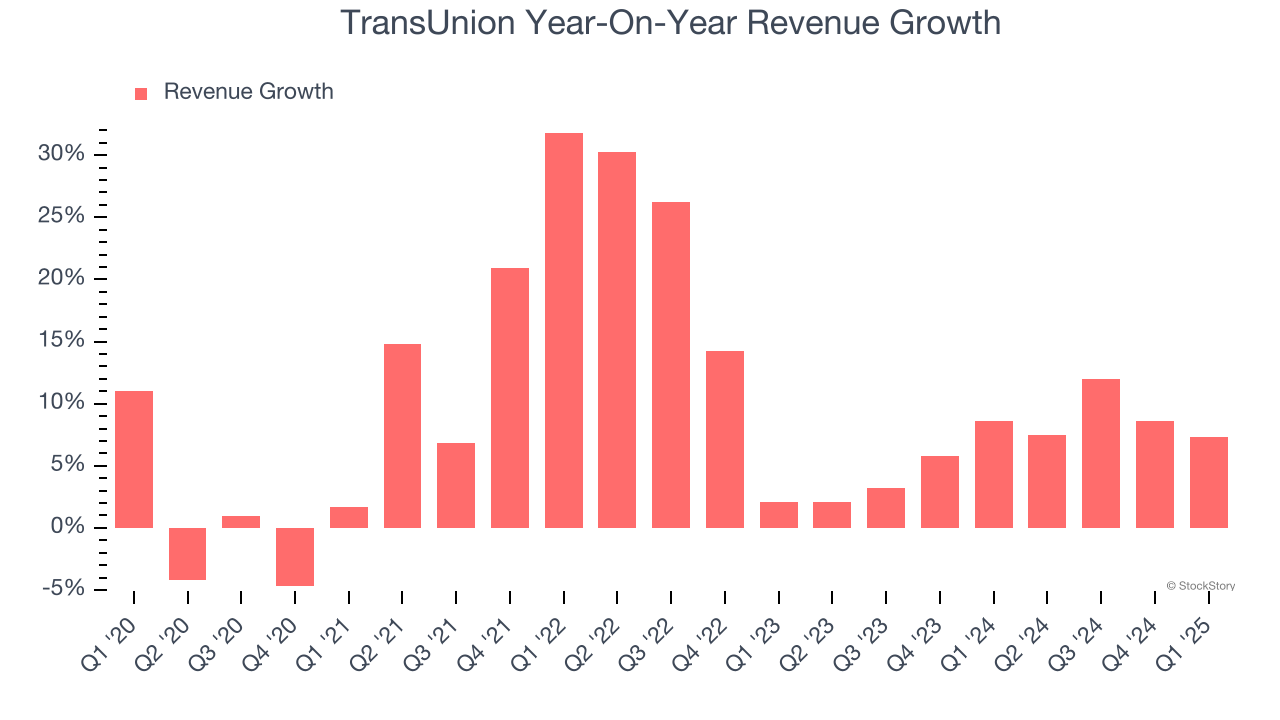
This quarter, TransUnion reported year-on-year revenue growth of 7.3%, and its $1.10 billion of revenue exceeded Wall Street’s estimates by 2.3%. Company management is currently guiding for a 4.3% year-on-year increase in sales next quarter.
Looking further ahead, sell-side analysts expect revenue to grow 5% over the next 12 months, a slight deceleration versus the last two years. This projection doesn't excite us and suggests its products and services will see some demand headwinds.
Today’s young investors won’t have read the timeless lessons in Gorilla Game: Picking Winners In High Technology because it was written more than 20 years ago when Microsoft and Apple were first establishing their supremacy. But if we apply the same principles, then enterprise software stocks leveraging their own generative AI capabilities may well be the Gorillas of the future. So, in that spirit, we are excited to present our Special Free Report on a profitable, fast-growing enterprise software stock that is already riding the automation wave and looking to catch the generative AI next.
Operating Margin
Operating margin is an important measure of profitability as it shows the portion of revenue left after accounting for all core expenses – everything from the cost of goods sold to advertising and wages. It’s also useful for comparing profitability across companies with different levels of debt and tax rates because it excludes interest and taxes.
TransUnion has been an efficient company over the last five years. It was one of the more profitable businesses in the business services sector, boasting an average operating margin of 15.5%.
Looking at the trend in its profitability, TransUnion’s operating margin decreased by 4.2 percentage points over the last five years. This raises questions about the company’s expense base because its revenue growth should have given it leverage on its fixed costs, resulting in better economies of scale and profitability.
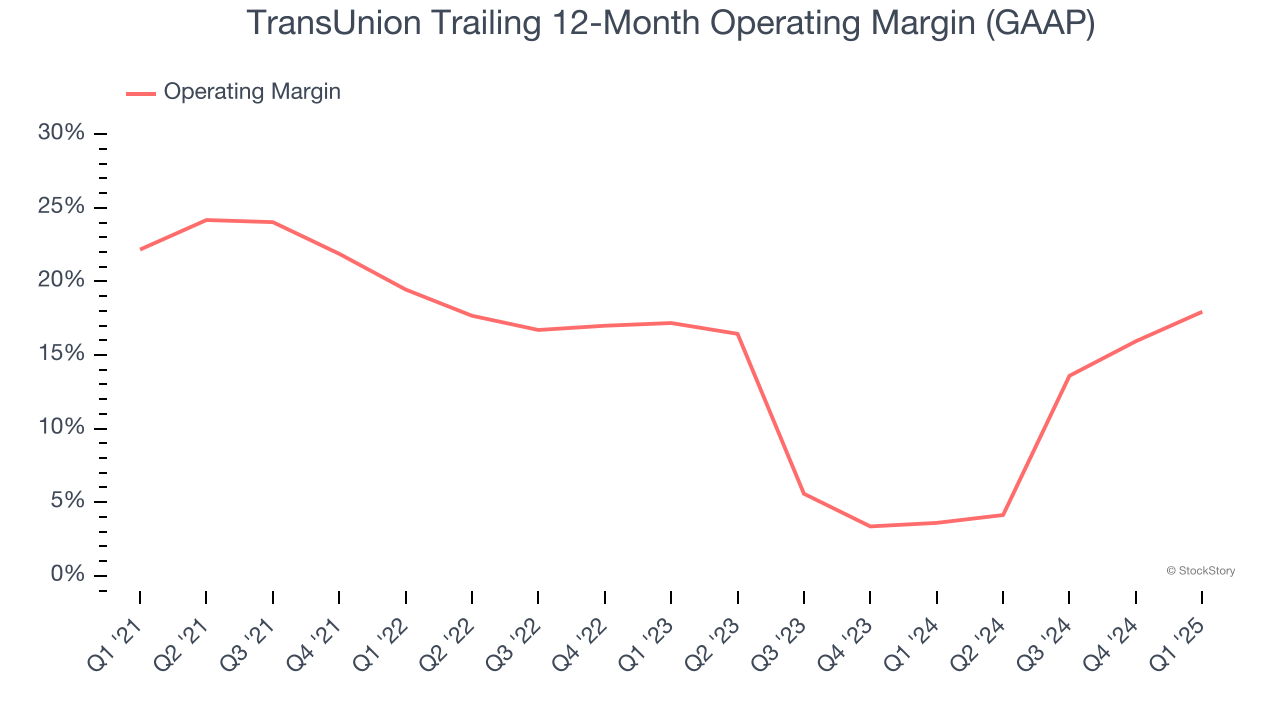
In Q1, TransUnion generated an operating profit margin of 23.2%, up 7.8 percentage points year on year. This increase was a welcome development and shows it was more efficient.
Earnings Per Share
Revenue trends explain a company’s historical growth, but the long-term change in earnings per share (EPS) points to the profitability of that growth – for example, a company could inflate its sales through excessive spending on advertising and promotions.
TransUnion’s EPS grew at an unimpressive 6.7% compounded annual growth rate over the last five years, lower than its 9.3% annualized revenue growth. This tells us the company became less profitable on a per-share basis as it expanded.
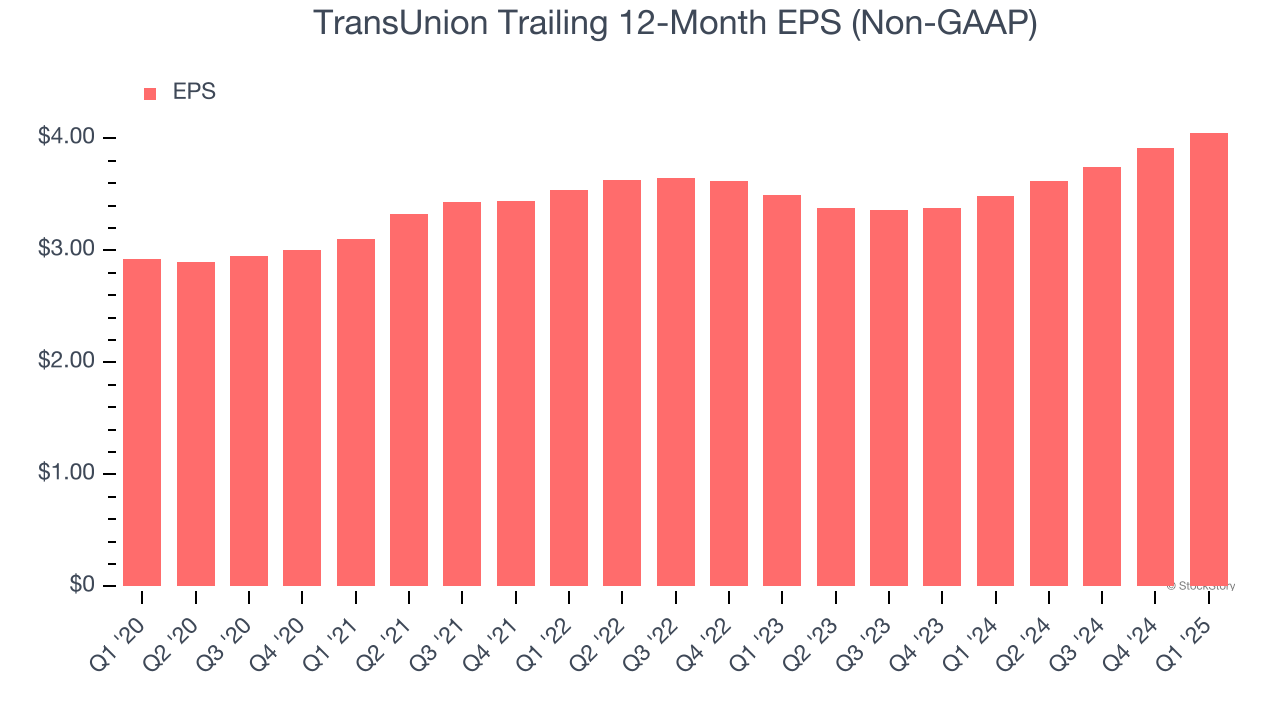
We can take a deeper look into TransUnion’s earnings to better understand the drivers of its performance. As we mentioned earlier, TransUnion’s operating margin improved this quarter but declined by 4.2 percentage points over the last five years. Its share count also grew by 2.7%, meaning the company not only became less efficient with its operating expenses but also diluted its shareholders. 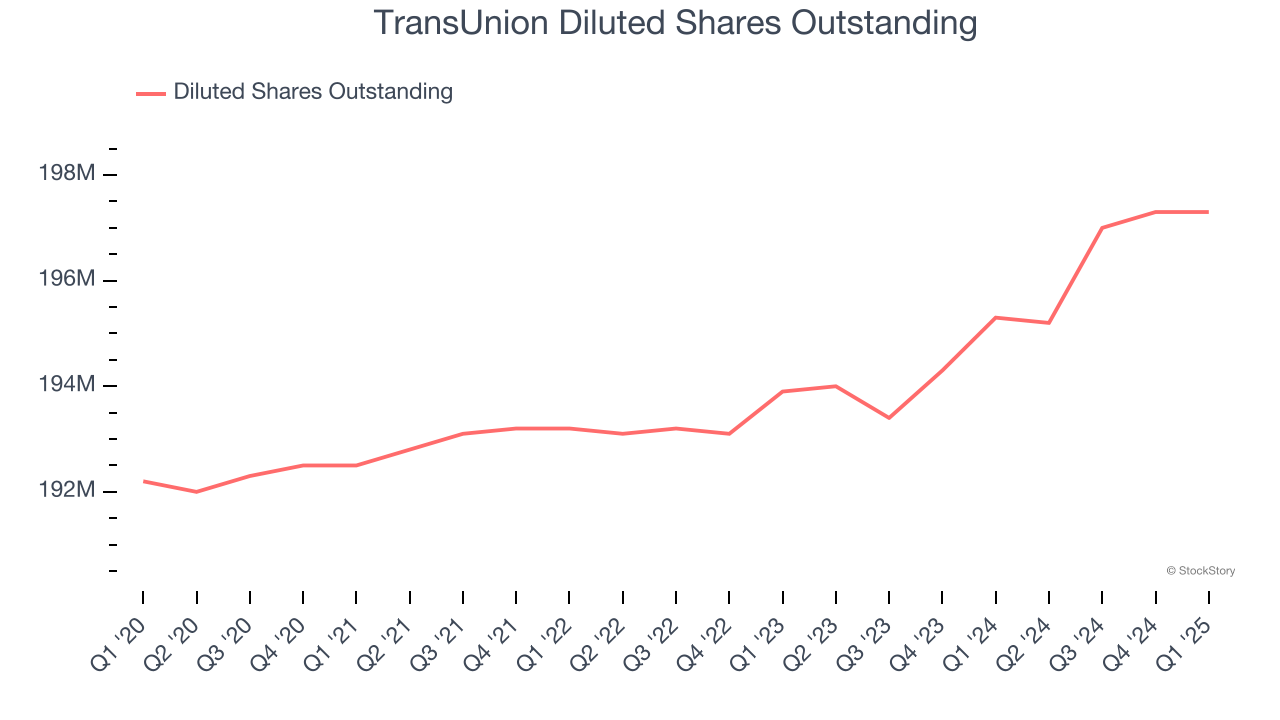
In Q1, TransUnion reported EPS at $1.05, up from $0.92 in the same quarter last year. This print beat analysts’ estimates by 7.3%. Over the next 12 months, Wall Street expects TransUnion’s full-year EPS of $4.05 to grow 4%.
Key Takeaways from TransUnion’s Q1 Results
It was encouraging to see TransUnion beat analysts’ revenue, EPS, and EBITDA expectations this quarter. On the other hand, its full-year EPS guidance fell short of Wall Street’s estimates. Overall, this quarter was mixed. The stock remained flat at $78 immediately after reporting.
So do we think TransUnion is an attractive buy at the current price? We think that the latest quarter is only one piece of the longer-term business quality puzzle. Quality, when combined with valuation, can help determine if the stock is a buy. We cover that in our actionable full research report which you can read here, it’s free.