
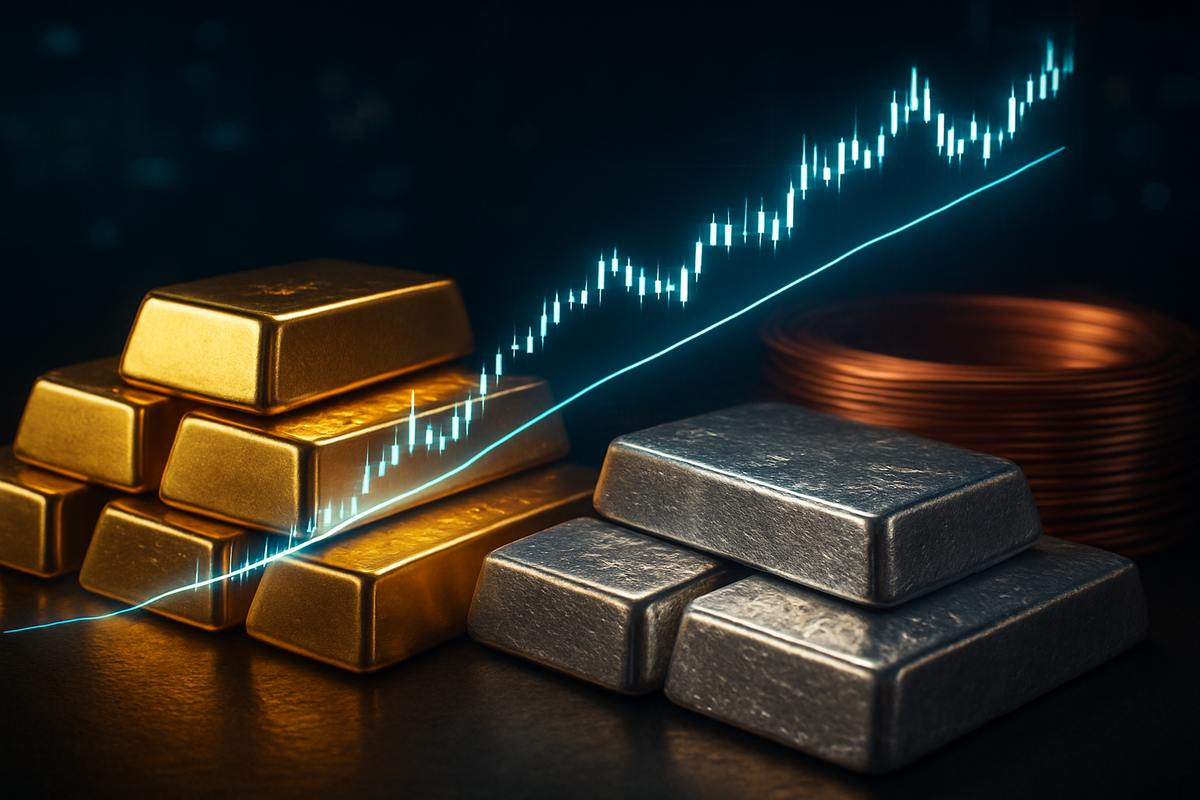
As the final trading session of 2025 draws to a close, the precious and industrial metals markets are providing a masterclass in technical resilience. Despite a sharp bout of profit-taking in the final weeks of December, gold, silver, and copper have managed to hold firmly above their critical 50-day moving averages (DMAs). This technical "floor" has signaled to institutional investors and retail traders alike that the historic bull run of 2025—which saw gold surge over 70% and silver more than double—is far from over.
The immediate implications of this technical health are profound for the broader market. By maintaining these key support levels, the metals complex has successfully "flushed out" speculative froth without breaking the primary uptrend. For exchange-traded funds like the SPDR Gold Shares (NYSE: GLD) and the iShares Silver Trust (NYSE: SLV), the ability to weather this end-of-year retreat suggests that the structural demand for hard assets remains the dominant narrative heading into 2026.
A Year of Records and a Healthy Correction
The journey to these year-end levels has been nothing short of extraordinary. Gold (XAU/USD) began 2025 with momentum but accelerated rapidly in the second half of the year, eventually peaking at an all-time high of $4,526 per ounce in early December. The rally was fueled by a "perfect storm" of factors: a weakening U.S. Dollar Index (DXY), which fell nearly 10% on the year, and a series of interest rate cuts by the Federal Reserve that brought the federal funds rate down to a range of 3.50%–3.75% by December 31.
Silver (XAG/USD) was the undisputed champion of the 2025 commodities complex, posting a staggering year-to-date gain of 138%. After touching a record high above $84.00 per ounce in mid-December, the metal experienced a "margin-call" correction—a common occurrence in highly leveraged markets—dropping roughly 11% in a single session. However, the sell-off found immediate buyers near the 50-day moving average, which currently sits near the $70 mark. Technical analysts point to this "buy the dip" behavior as evidence of a "regime change" in how investors view silver, moving from a speculative play to a core industrial and monetary asset.
Copper, often referred to as "Doctor Copper" for its ability to pulse-check the global economy, also joined the rally, hovering near $5.67 per pound ($12,500 per metric ton) as the year ends. The metal has been propelled by a widening structural deficit, exacerbated by the explosive growth of AI data centers and the continued electrification of the global energy grid. Even as broader equity markets showed signs of fatigue in late December, the "Red Gold" of 2025 remained buoyant, supported by its own 50-day average near $5.20.
Corporate Winners and the Mining Renaissance
The sustained high prices of metals have fundamentally reshaped the balance sheets of the world’s largest mining companies. Newmont Corporation (NYSE: NEM), the world’s largest gold miner, has seen its margins expand to record levels as the all-in sustaining cost (AISC) of production remained relatively stable while the spot price of gold climbed nearly $2,000 per ounce over the course of the year. Similarly, Barrick Gold (NYSE: GOLD) has utilized its windfall profits to accelerate share buybacks and increase dividends, rewarding investors who stayed patient during the leaner years of the early 2020s.
In the silver space, companies like Pan American Silver (NYSE: PAAS) and First Majestic Silver (NYSE: AG) have transitioned from survival mode to aggressive expansion. The massive price appreciation in silver has made previously uneconomical deposits highly profitable, leading to a surge in exploration budgets for 2026. However, the real winners may be the "Junior" miners, captured in the ETFMG Prime Junior Silver Miners ETF (NYSE: SILJ), which outperformed the physical metal as investors sought the operational leverage that smaller producers provide.
Conversely, the high cost of industrial metals has placed significant pressure on downstream consumers. Large-scale manufacturers and technology firms requiring massive amounts of copper for power infrastructure, such as Freeport-McMoRan (NYSE: FCX)—which acts as both a producer and a bellwether for industrial demand—have had to navigate a landscape of rising input costs. While miners win, industrial users are increasingly turning to the futures market to hedge against the possibility of $15,000-per-ton copper in the coming year.
The Macro Significance of the 50-Day Floor
The technical health of the metals market is not occurring in a vacuum; it is a reflection of deeper shifts in the global macroeconomic and geopolitical landscape. The fact that gold and silver are holding their 50-day moving averages suggests that the "Safe Haven" trade has become a permanent fixture of institutional portfolios. Throughout 2025, persistent conflicts in the Middle East and the ongoing Russia-Ukraine war provided a constant floor for gold, while trade tensions—including the implementation of universal tariffs—stoked fears of structural inflation.
Furthermore, the 2025 rally has been characterized by a notable shift in central bank behavior. While Western retail investors were slow to enter the market in the early stages, central banks in emerging markets continued to diversify away from the U.S. dollar at a record pace. This "de-dollarization" trend provided the underlying liquidity that allowed metals to shrug off the end-of-year retreat. Historically, when gold and silver hold their 50-day averages during a correction, it often precedes a "secondary breakout" that can be even more powerful than the initial move.
The technical setup also highlights a divergence between "paper" markets and physical reality. While high-frequency trading algorithms may trigger sell-offs on technical breaches, the physical demand for silver in solar panels and copper in AI infrastructure provides a fundamental backstop. This "physical floor" is what technical analysts believe is being reflected in the 50-day moving average, creating a synergy between chart patterns and real-world supply-demand imbalances.
Looking Ahead: The Road to 2026
As we move into the first quarter of 2026, the primary question for investors is whether the 50-day moving average will continue to hold as support or if a deeper "retest" of the 200-day moving average is in the cards. Most analysts remain decidedly bullish, with price targets for gold in 2026 clustering between $4,700 and $5,000 per ounce. Silver is expected to enter a "price discovery" phase, with some aggressive forecasts suggesting a move toward the psychological $100-per-ounce mark if the structural supply deficit persists for a fifth consecutive year.
Strategic pivots are already underway among major institutional players. Wealth managers who previously allocated 1-3% of portfolios to precious metals are now discussing 5-10% allocations as a hedge against "fiscal dominance"—the idea that government debt levels will require permanently lower real interest rates. For the Global X Copper Miners ETF (NYSE: COPX), the focus in 2026 will be on whether new supply can finally begin to hit the market, or if the "AI-driven" demand surge will continue to outpace production, leading to even more parabolic price action.
Closing Thoughts: A Robust Technical Foundation
The end-of-year retreat in the metals market should be viewed not as a sign of weakness, but as a necessary "reset" that has validated the strength of the current bull market. By holding above their 50-day moving averages, gold, silver, and copper have demonstrated that the path of least resistance remains higher. The combination of a dovish Federal Reserve, persistent geopolitical risk, and a structural shortage of industrial metals creates a compelling backdrop for the year ahead.
For investors, the key takeaway is that the "Metals Supercycle" of the mid-2020s appears to have a solid technical and fundamental foundation. While volatility is a guarantee in the silver and copper markets, the trend remains firmly up. Moving into 2026, the market will be watching closely to see if gold can make its run toward $5,000 and if silver can finally break its decades-old real-dollar records. For now, the charts suggest that the bulls remain in total control.
This content is intended for informational purposes only and is not financial advice.


